December 2017
“It will take all the “stiff upper lip” symbolized by Queen Victoria to overcome the economic storm unleashed from the British leaving the European Union”
La Stampa, Italian newspaper.
“You can check-out any time you like,
But you can never leave!”
Hotel California by the Eagles
CLICK HERE TO DOWNLOAD A PDF VERSION OF THIS PAPER (3 MB)
Watch a video interview with Dr Andrew Black at the launch event, 4th December 2017:
Executive Summary
The two quotations cited above make the following points. Firstly that the likely economic storm that could yet engulf the UK post Brexit is going to take all the fortitude possible to manage it. And secondly, as with the Hotel California, however many times the UK tries to check out from the hotel (EU), it will never be able to leave. Geography, history, culture and economics all force the UK to have close and active relationships with the EU. And this makes the idea that after a Hard Brexit, the UK will enter a period of sunlit highlands and a global El Dorado misleading and delusional
The analysis here reinforces the conclusions from an earlier paper (Black 2017a) that a Hard Brexit is something to be feared and not welcomed. And that the “No deal is better than a bad deal” approach recommended by the current Prime Minister is a bad alternative. This paper spells out possible outcomes in terms of Hard Brexit impacts on sectors and regions within the UK. And this is done in a framework that integrates both macro assumptions and sector and regional outcomes in a consistent manner.
This report includes an assessment of Non Tariff Barriers and how their imposition might affect the fortunes of the large and successful service sectors. Omitted from the earlier analysis, its inclusion here helps to compare outcomes across the whole of the economy. The estimates are informed by a survey of other authors’ contributions, and by this writer’s views.[1]
The results here are sobering. In absolute terms the impacts of higher, Brexit related, trading costs in the service sectors are large, and concentrated in London and the South East. Using a methodology similar to that used to estimate Brexit trading costs for manufacturing sectors, there are risks of substantial drops in service sector output.
However, relative to the size of the sector, as well as relative to the size of the standard UK regions’ economies, it is the losses in manufacturing being both more regionally concentrated, and experiencing higher potential tariff costs, that drag down the fortunes of the North and Midlands. The results suggest that
- Those regions that voted most strongly to leave the EU, notably the West and East Midlands, the North West, North East and Yorkshire, will endure greater economic losses proportionate to their regional economies than will the South East and London.
- There is much clearer congruence between political voting behavior and economic interest in the Remain areas, and notably for London and Northern Ireland. The congruence between politics and economics is weaker in the case of Scotland, although on a narrow tariffs only view (Scenario A) Scotland is the most strongly negatively affected region.
From a sector view, the sectors most strongly negatively affected by a Hard Brexit are Transport Equipment, Textiles, Rubber/Plastics, food processing, electrical equipment and agriculture – all when measured against the size of these sectors’ overall output. The main results are shown in table 1 below.
Table 1: Main assumptions and outcomes of the model scenarios.
| Scenario number | ||||
| All Values are Outputs from the IO model (except Scenario A) | A | 1 | 2 | 3 |
| Scenario Name | Gross Trade Tariff Burden | Short Sharp Knock | Longer, slower response | Slow Growth in sectors with High IIT index |
| # of years | At imposition of Hard Brexit | 1 | 5 | 1 |
| Overal Gross Output Change | -0.78% | -6.20% | -9.20% | -11.60% |
| Range Max | -5.00% | -9.50% | -9.50% | -40.00% |
| Range Min | 0.00% | -2.00% | -2.00% | 0.00% |
| Most affected industries ranked by size of % output change | Textiles, Transp Equip, Rubber, Food Proc, Elect equip | Textiles, Transp Equip, Rubber, Chemicals machinery | Transp Equip, Rubber, Elect equip, Chemicals, Machinery | Elect equip, Computers, Chemicals, Agric, Food Processing |
| Most Affected Regions ranked by size of % output change | Scot, Yorks, NE, E Mid, W.Mid | W.Mid, E.Mid, NW, NI, Scot | W.Mid, E.Mid, SE, E.Eng, London | NI, E.Mid, NW, W.Mid, Yorks |
Further details about the scenarios can be found below.
The absolute losses of output for some service sectors might well be larger than in manufacturing, yet relative to the overall sector size they are not as worrying. The analysis suggests that London and the South East will be more resilient against any post Brexit storms than will be the North and the Midlands
The analysis also provides some evidence that the impact of the various scenarios is likely to support the longer term trend towards further de-industrialization of the UK economy, which may have further unwanted side effects.
The approach used in the report involves the linking together of four different databases. These are the WIOD Input Output tables, using 2014 as the base year. WTO tariff information, linked with the HS trade nomenclature of the United Nations. This allowed us to calculate the expected Hard Brexit trading costs. The ONS regional Gross Value Added statistics, also for 2014. The analysis was conducted using a synthetic 33×33 matrix that made it possible to map information from the various sources across to the Input-Output tables in order to obtain consistent results. The results were obtained from running four different scenarios using different input assumptions about macroeconomic policy. Additional assumptions about Brexit related trading costs for the service sectors were made (Appendix 1).
As with other work of this kind, the analysis considers several “what if” situations. Under the specified assumptions, the model provides estimates of what might happen. IO analysis is one of the few ways in which an integrated approach to macro level decisions and sector level (meso) outcomes can be measured.
Contents
The UCITS example and “passporting”
Regional Impact of Trade Effects
Economic Trade and Regional Scenarios using an Input Output approach
Scenario A: Impact of the Tariff Burden
Scenario 1: “Short Sharp Knock”
Scenario 2: Longer, slower losses over a 5 year period
Scenario 3: Slow Growth in sectors with High IIT index
Introduction
This paper looks at the regional consequences of a Hard Brexit scenario. It follows an earlier paper (Black 2017a) that used an Input-Output approach to examine the possible impact on 55 sectors of the UK economy under a number of plausible economic scenarios. The advantage of the approach being that it linked the broader macro economic developments and assumptions to possible more disaggregated sector outcomes.
There are several paths that can be followed to achieve a given macro outcome. For instance, a macroeconomic estimated rate of change of 3% could be achieved with all the adjustment costs falling on just one sector – say exports, or by changes to household incomes. These in turn will affect individual sectors differently. The scenarios used here specify particular paths linking a macro outcome with specific economic behaviour – seen here as changes to final demand. Owing to the inter-dependencies between sectors and between intermediate and final demand, each scenario will have different outcomes for individual sectors. The scenarios outlined below provide a bridge between general macroeconomic consequences and specific sector outcomes. The range of estimated macro results following various types of Brexit are shown in Black (2017a)[2].
The main results of the earlier study clarified the inter-connectedness of the UK economy, not just on foreign trade, but also domestically. It demonstrated how a single “simple” figure of say a 3% reduction in output could mask a much wider dispersal of results for specific regions. Indeed, a 3% macro reduction could be associated with individual sector output drops of 6 or 7% at the upper end, and virtually zero change at the lower end.
Trading costs were estimated using the approach developed in Black (2017a).[3] Weighted average WTO tariff rates were calculated and shown across 33 different industry sectors. The core assumption behind a Hard Brexit is that no agreement is reached between the UK and the EU, resulting in an immediate switch to WTO trading conditions at the end of the Article 50 exit negotiating period.
This would mean that exports from the UK to the EU would be subject to the Common External Tariff. On leaving the EU trading bloc, under WTO rules, the UK would immediately inherit the EU’s own Schedule of Concessions concerning its new tariff regime, meaning the UK would impose tariffs on imports from the EU.
It would be a “mirror” image of the EUs position, since the way the current system works, all EU member states, who are also members of the WTO, have identical tariff policies, embodied in a single joint Schedule of Accession.
Post Brexit, the UK would be obliged to use this Schedule of Concessions, for the simple reason that it is already agreed among all WTO member states. Were the UK to want to change elements of this schedule, agreement would have to be reached with all 164 WTO members, which will be time consuming and complex.
Even so, difficulties remain. The US, Canada, New Zealand, Argentina, Uruguay, Brazil and Thailand recently all objected to a UK-EU deal that “amicably” arranged to split agricultural quotas agreed between the EU and other countries with the UK. In the WTO system such concessions cannot be disposed of by the EU and UK alone, since it affects other countries with large agricultural exports. This is just the tip of a large iceberg.[4]
This paper includes the estimated costs of Non Tariff Barriers (NTBs) on service industries. The details are shown in appendix 1. The costs are estimated at between 5 and 10% of the volume of EU/UK service trade flows, making this a relatively benign assessment. The difficulty being that services play such a large role in the UK economy that assumptions about NTBs will by their nature dominate the analysis of possible Brexit impacts, as will be shown in more detail below.
Another issue with service sector trade is that NTBs involve issues of market access. Either access is given on more or less equal terms, often using the principle of a “passport”. This gives permission to accredited services and related products to be sold across the whole of the Common Market. Without such a passport access to the Common market is denied.
In the event of such a denial, it is unlikely that substitute markets of the same volume and proximity could be found in the short run. The effects of a service sector passport denial have not been factored into this analysis.
The WTO though has found it difficult to reach multilateral agreements on services. Indeed, difficulties on reaching international agreement over services contributed to the breakdown of the WTO Doha Round of multilateral trade negotiations. This in turn, led to the subsequent rise in bilateral, or occasional multilateral agreements between regional trading blocs.[5]
For services the issue is about the access service providers have to foreign markets, and for the recognition of either service suppliers, or of the compliance of different service offerings with local rules and regulations. One good example shown here, and there are many more, can be seen in the development of UCITS products in financial services. With the passage of time, what initially started as a relatively simple agreement between member states ensuring access via a passport has evolved into a far more complex series of agreements that govern many aspects of market behaviour in the sale and distribution of mutual funds across the EU. And the only arbiter on disagreements with external non EU suppliers is the EU Commission. Appeals, “over the heads” of the EU to reach individual member states will be pointless, since all are now signed up to, and committed to the enforcement of current binding legislation.
Needless to say, once having left the EU, the UK will no longer be able to control or influence how the common market trading regime will evolve. The UK will then be faced with the choice of either having to “put up, or shut up” – to either accept the current rules, or cease to trade with the EU.[6]
The UCITS example and “passporting”
UCITS refers to the Undertaking for Collective Investment in Transferable Securities, which deals with the production and selling of mutual funds (unit trusts) across the EU. In 1985 it was realized that considerable fragmentation existed within the EU making it impossible for suppliers of a mutual fund in one country to offer the same product to retail investors in another. And each member state has, and had, different rules protecting retail investors.
The “confederal” approach therefore supported the continuation of this fragmented market, which protected suppliers in the larger countries, and restricted competition and new entrants. In 85/611/EEC, a directive came into force to improve the situation. Any product that was authorized by one member state could be sold and distributed across the Union – although member states still had the right to impose their own consumer safeguards.
It was quickly realized that considerable local regulations around the marketing of such products remained that basically sabotaged the creation of the Europe wide market. At that time (1990) efforts to further harmonize conditions across member states were abandoned as being too ambitious. This turned out to be a pause only.
In 2001/108/EU, another directive (UCITS III) created a European passport that allowed fund managers to operate across the EU. The harmonization process continued with UCITS IV in 2009, approved by the European Parliament, including a series of additional cooperation measures, such as the cooperation between member state regulators. This has since been replaced with a more detailed UCITS V agreement (2014).
This example, shows how in the service sector the EU has developed a network of rules and procedures that apply to the member states, as part of the construct called the internal market. And this is, necessarily, not open to non-members. It defines one of the benefits of being in the club. Over time the nature of the agreements has changed, and has touched on a widening circle of issues related to creating and sustaining a single common market. Much of this development has been wrapped up in the creation of a service passport making access to the Common Market easier.
In the event of a Hard Brexit, the UK would be outside of the club. UK producers would therefore, more or less at a single stroke, lose their European passports. If they wanted to sell their products in the EU, their choices might be limited to seeking a bilateral deal with each member state, just for that territory. Or to accept that the only way of accessing the whole market was to relocate to within the EU, and operate a largely separate operation there. The EU based operation would then comply with EU rules, capital ratios and many other aspects.
When seeking to retain a European passport, suppliers will have to deal with the EU. The Commission and related authorities, running under the ECJ system of legal enforcement, are the institutional counter-parties. There will be no “transparency” allowing the UK to deal with member states separately, except under the limiting conditions of a local bilateral arrangement. And each bilateral arrangement could well differ, thus driving up costs of the entire exercise, probably to the point where it no longer made economic sense to do this.
Each and every service sector will involve different agreements. In some cases it may be the mutual recognition of qualifications (as in health). In others it may be related to capital ratios and shareholding structures. In others to differing levels of information disclosure, background checks, the confidentiality of customer information etc. The major risk for the UK providers (insofar as they remain located in the UK), is that this will multiply the “red tape” associated with trade with the EU, making it generally more difficult and time consuming than current single market arrangements. And in some cases, UK providers may be faced with stark choices as to whether they can continue to source services to the EU from the UK at all.
For the purpose of this study the following approach has been adopted. A top down view on the relative risks and opportunities facing the main service sectors was made, and a certain cost was assumed relating to the trade flows between the UK and the EU. Following the approach used for the tariffs, these costs were then applied to the sector, and treated as reductions in the final demand for the sector. The details can be found in appendix 1. Generally they were estimated to be between 5 and 10% of the trade values, which in some respects is a relatively optimistic view on the impact a Hard Brexit might have on the service sectors.

Chart 1: NUTS 1 regions of the UK[7]
Source: By Dr Greg and Nilfanion. Contains Ordnance Survey data © Crown copyright and database right 2011, CC BY-SA 3.0, https://commons.wikimedia.org/w/index.php?curid=19415660
Note: The code letters used to identify the various regions are not the same system used to describe the main 33 sectors used throughout the rest of this paper. The NUTS region codes shown in the map are, running from North to South, are: Scotland (M), Northern Ireland (N); North East (C),
Yorkshire/Humberside (E), North West (D), Wales (L), West Midlands (G), East Midlands (F), East Anglia (H), London (I), South East (J), South West (K).
Regional Impact of Trade Effects
There are two ways of understanding the trade effects on the regions. The first is to consider their actual size in value terms. The second approach is to look at their relative impact in relation to the size of the region.
It is helpful to understand more about the nature of the UK economy and its regional components. Unlike some other countries, the UK has no formal arrangement where issues of regional equality have any constitutional role. In Germany, under the constitution (Grundgesetz), the government is tasked with ensuring that regional disparities do not rise beyond certain limits. This does not always mean that the outcomes are kept within the desired bands, but efforts are made to do so. And this provides a justification for elements of a regional policy, partly enshrined by the role of the Länder in the German constitution. There is nothing as well developed as this in the UK. And in terms of government policy there is the (in)famous Barnett formula, which is a back of the envelope arrangement for dividing up government funding across the United Kingdom according to a pre-determined formula.[8]
Chart 2 provides an analysis of how gross output for 2014 was divided up amongst the main sectors of the economy. For the purposes of this paper a 33×33 Input Output table was used. so that it could be linked to ONS Gross Value Added statistics using the same 33 sectors. The GVA figures provide the link between the IO tables (sector based) through to the regions.[9]
The chart shows the share of gross output by sector for 2014, and the importance of service activities. These include wholesale and retail activities (ranked 1), financial services (ranked 2), construction (3), real estate activities (ranked 4), human health and social work services (5) and professional, scientific and technical services (ranked 6). In discussions around Brexit and much else, it is surprising how little attention has been given to any service sector other than financial services.
The chart also shows those sectors subject to non tariff barriers of the sort described above. Non tariff barrier sectors are coloured yellow/orange, and industries subject to tariffs, are coloured red. As can be seen, tariffs tend to affect the smaller industries. Services with blue bars are largely domestic in nature and are not considered to be that sensitive to either tariff or non tariff barriers.
Chart 2

Source: WIOD & author’s calculations
Chart 3 compares the size of the individual service sectors amongst themselves. On this basis wholesale and retailing is the largest service sector, followed by financial services. Real Estate, Health and Professional Services then follow close behind.
Chart 3

Source: WIOD & author’s calculations
The reason for the greater public attention paid to financial services is not immediately clear. The value added in the sector is higher than for other services. Its export performance though is not particularly high. Both Professional Services and Real Estate have much better records in this respect.
How does this translate into the regions? Chart 4 takes information from the Office of National Statistics (ONS), looking at gross value added (GVA) and regional population estimates for 2014. Gross value added consists of wages and salaries as well as gross operating profits. It broadly measures the “surpluses” produced in the economy, shown here by the main NUTS 1 regions.[10]
Chart 4

The chart shows how England dominates the economic picture. Scotland, Wales and Northern Ireland all score less than 10% each. The two largest sub regions are London and the South East, between them accounting for around 35% of the total UK GVA. This share is greater than their respective shares of population, and these two regions have the highest incomes in the UK.
The differences become even more striking when GVA per capita is considered. The average for London is around £41 thousand per person per year. This is more than double for the poorer regions such as Wales and North East where their equivalent GVA per capita is around £20 to 21 thousand per person. When looking more deeply into London, figures for the City of London, Camden and Tower Hamlets (Canary Wharf) boroughs all show GVA per capita of over £100 thousand per person per year. All of which underscores just how divided a society the UK is, and how powerful London and the South East are.
Chart 5 Regional Specialization, ranked by size of sector in the national economy

Chart 5 shows the extent to which specialization has occurred in the different regions. The cells marked with Green indicate those sectors where the regional presence is greater than the national average, thus indicating some specialization in that region.
Thus, for the London region, there is much higher than average concentration in the service sector and an under-average representation in manufacturing industries. For the South East there is a similar over-representation in services, as well as over average presence in some manufacturing areas such as computers & IT, and in electrical equipment. The North West, North East, Midlands have above average representation in manufacturing related activities.
Chart 6 indicates how much regional specialization is occurring. An above national average presence of a sector in a region shows that there is more of this sector’s activity occurring in that region than might have been expected. Yorkshire, and the East of England have the highest number of specialized (above average) sectors. Scotland and Wales and Northern Ireland have less specialized sectors than England. And the region with the fewest number of specialized sectors is London, indicating how London’s eggs are very much in the single sector of Financial Services.
Chart 6: Number of Specialized Sectors per Region with above average activity levels compared with the UK.
| # of above average sectors | |
| Region | # Above Average Sectors |
| England | 16 |
| North East | 12 |
| North West | 13 |
| Yorkshire and The Humber | 18 |
| East Midlands | 16 |
| West Midlands | 13 |
| East of England | 18 |
| London | 9 |
| South East | 15 |
| South West | 15 |
| Wales | 17 |
| Scotland | 14 |
| Northern Ireland | 14 |
This then defines the structure of the UK economy which is used for the rest of the analysis.
Brexit Trade Effects
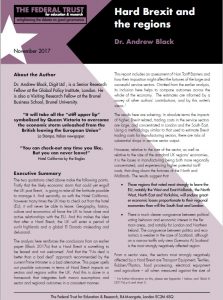
The trade effects following a Hard Brexit are defined as the related tariff and non tariff costs arising on trade between the UK and the EU. The regional distribution of trade effects is shown in chart 7 below. Regional trade effects are compared to regional gross output. [11] England dominates the picture. At the sub national level, trade effect share of Gross Output is largest in London, and the South East, followed by the North West, West Midlands and Scotland.
Chart 7: Trade Effects Share of Gross Output by Region
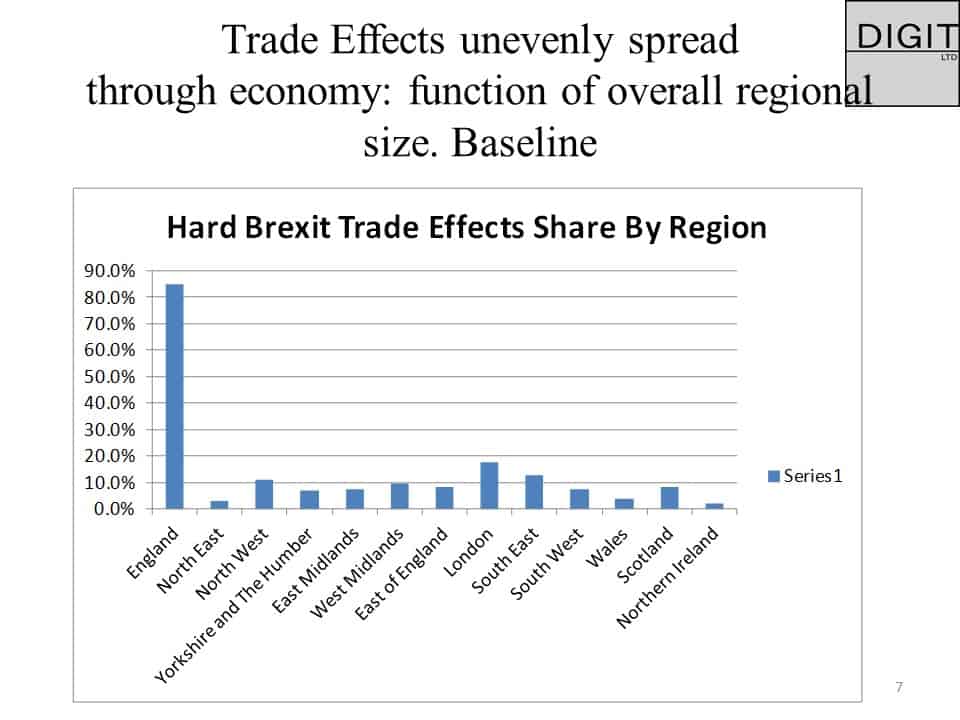
Chart 8 illustrates how Brexit trade effects (costs) appear on a sector basis. It shows trade costs as a share of sector gross output. The sector most stricken by additional Brexit related trade costs is textiles. This industry enjoys a high level of protection, which helps the textile industry in all member states, including the UK.
Although the textile industry is relatively small, it arguably depends on its high level of protection. More generally, any post Brexit removal of this protection, as part of an ill thought out Brexit “free trade” approach, could have the effect of rapidly terminating a number of sectors in the UK, including most of agriculture.
Transport equipment is another case in point. Its entire business model is developed around international specialization. Components are often traded within the EU widely, again to take advantage of scale economies and specialization. Hard Brexit will effectively end these arrangements. And the economics of paying tariffs on in and outbound goods will drastically reduce sector profits, if not worse. Food products, electrical equipment, and agriculture are also faced with steep increases in costs following a Hard Brexit.
Chart 8

This is not a wholly “doom and gloom” story. One sector looks set to grow and to benefit from Brexit namely the Public administration and defence sector. The reams of red tape and other enforcement measures that will be required for a Hard Brexit suggests that existing staff will need to be boosted, and that far from having trading costs, the sector may enjoy a comparatively rosy period. It remains debatable whether increasing activity will do much to improve UK overall productivity[12]. And for many it will also be debatable just how much “control” will be won back. Economic participants will have to deal with stony faced British officials instead of more remote Brussels bureaucrats. Efficient it will not be.
This represents the only tangible “upside” from Brexit identified here. A Hard Brexit will involve substituting trading in a free trade zone, to trading in an area with much higher tariffs, making it hard to see just where a trading benefit is to be expected. Further details on this can be found in Black (2017a).
The regional impact of the additional trade costs alone, are shown in chart 9 below. At first sight, this looks reassuring. The figure for the UK as a whole is slightly less that 0.8% of gross output. There is some regional variation, with the North East, Yorkshire, East Midlands and the West Midlands and Wales all having higher trade costs. As shall be shown below, this is only the beginning of the story.
Chart 9

Economic Trade and Regional Scenarios using an Input Output approach
The Input-Output analysis indicates what the likely impact of Brexit will be at a sector level. It can also be extended to include regional effects. The approach is relatively straight forward, and requires relatively few additional assumptions, other than those contained in the IO tables/approach themselves.
The economy, as measured by gross output (X), can be defined as the sum of intermediate production (A) and final demand (FD). In the Input Output view, these relationships hold for 33 individual sectors. Intermediate production is used to produce other commodities, whereas final demand consists of goods and services consumed. There are six types of final demand, representing goods consumed by private households, by non-profit organizations, by government, for investment, for exports, and as changes in stocks. The overall changes in final demand can be used to calculate what the overall change in gross output will be. All of this is in terms of 2014 prices.
Import Tariffs are a price phenomenon. Ideally details of the price elasticity of demand per sector would be needed in order to estimate the effects of price changes on demand. These are not available. In order to simplify the analysis, and for the purposes of the argument, it is assumed that import tariffs affect intermediate output only, and are treated as an additional cost. With a given gross output, the “base line” gross output balance can only be maintained after the imposition of tariffs by lowering the overall efficiency of the system, in this case by lowering the surpluses earned as represented by final demand. And this is what is done in the following sections. The imposition of import tariffs is treated as a decline in the system’s overall efficiency, and thus as lower final demand. Tariffs on exports are also treated as an additional cost (see Black 2017a for more details).
The initial incidence of these trade costs is obtained from the WTO as explained in Black (2017a). As demand falls, there are then ripple (multiplier) effects through the rest of the economy. Lower final demand means lower intermediate demand, which in turn leads to second, third and fourth round effects on other sectors. These effects are captured by what is known as the Leontief Inverse, named after an economics Nobel prize winner of the same name.
As we shall see, even relatively small changes in final demand caused by the imposition of additional trade costs lead to larger falls in overall gross output, a point not captured in many other analyses.
These initial trade effects (scenario A) are then linked to broader negative economic effects and trends identified in other studies summarized in Black (2017a). And here rather than taking a global x% reduction in GDP, scenarios are constructed weighted towards proportionately greater reductions in private household consumption, lower investment and in lower exports. [13] Using this approach allows us to estimate both the direct, and indirect (“ripple”) effects throughout the economy following the imposition of Brexit tariffs, as well as in their interactions with other changes in demand identified in other studies. This then is the background to the IO analysis.
It might be argued that this is fundamentally too negative a view to take, and it certainly differs sharply from the Panglossian views of the future being broadcast by Brexit supporters. The same group also trumpets the view that there has been no recession as predicted in the aftermath of the Brexit referendum (June 2016), and hence all such related forecasts are therefore entirely erroneous representing another example of the tendency of “experts” to undermine the views of “honest patriots”.
In our view this is entirely mistaken. Brexit has not happened yet. Moreover, it looks as if, in the absence of a Hard Brexit, an additional transitional period might yet be negotiated where the UK remains within the Common Market. Clearly with Hard Brexit postponed, then one of the basic assumptions of the analyses in 2015/2016 has been breached, and it is not surprising that the doom and gloom predicted earlier has not yet happened.
The analyses and scenarios shown below aim to capture the impact of, what might be described as, a widespread loss of confidence in the UK economy. This is most likely to arise over the continued failure of the British government to adequately negotiate the semblance of a deal with the EU. This is un-nerving businesses who are putting off making investment decisions in the UK. And if they are international “meso” level corporations, they may well continue to invest elsewhere, but not in the UK.[14]
This analysis also includes a regional dimension. There are striking imbalances in the UK economy, and these contribute to the different regional responses to the Brexit referendum. Three areas voted to remain in the EU, London, Scotland, and Northern Ireland.
London has the largest economy in the UK; it is the most open and integrated region into the rest of the EU and global economy, and it is heavily dependent on financial and other service industries. Many voters clearly identified with this type of activity and foresaw how threatening leaving the EU would be. There appears to be a reasonably close correlation between their economic interests and their voting behaviour in the referendum
Northern Ireland’s economy has grown closely together with that of the Republic of Ireland, particularly since the Good Friday agreement, which was predicated on the UK and the Irish republic both being members of the EU. In many respects, such as in electricity generation and in agriculture, the two regions are now completely inter-dependent. To such an extent that even the Ulster Unionist party has tolerated the situation. There was a clear understanding that any move towards a “hard border” ,and to an ending of the Common Travel Area following a Hard Brexit would impose hardship on the Northern Irish economy. Here too there appears to be convergence between the region’s economic and political perspectives.
Scotland: Scotland’s economy is affected differently according to the scenario used. When just looking at the direct and indirect trade effects, Scotland is in the top position and is the most sensitive to a Hard Brexit. However, as the scenarios become harder, so other regions are more badly affected than Scotland. Scotland appears to be more resilient than many other northern English regions.
Future Economic Perspectives
The outlook for the British economy looks very mixed. Regarding future UK economic prospects, inflation has been accelerating due to the 15% devaluation in the British pound since the referendum. This change alone is larger than any change of inputs assumed in any of the scenarios. As it is, the 15% devaluation, together with changes in commodity prices, is pushing up inflation towards 3%. And this in turn is squeezing private disposable incomes, and starting to reduce consumer demand. The September 2017 figures on automobile sales recently released by the SMMT show a 12% year on year decline in car sales.[15] On top of this property prices are now starting to fall in London.
The UK now has the weakest growth (Q2 2017 GDP) in the G7. The Office for Budget Responsibility (OBR) has recently revised downwards it assumptions about UK productivity growth, a crucial driver of output, taxes, profits and incomes. This will reduce the fiscal options available to the government, and its ability to respond to further reductions in final demand. All of which suggest the scenarios used here are far from unrealistic.
To put the results shown below into perspective, they are equivalent to another Great Financial Crisis, quite possibly stretched out over a longer period of relative decline – possibly similar in scope to what the UK experienced in the 1970s during oil crises and miner’s strikes. It may be recalled that for a long while the production peaks reached in 1973 were not surpassed in some sectors for more than fifteen to twenty years. When the industries themselves subsequently went into terminal decline, they were never surpassed.
The following scenarios are presented to highlight the possible implications of a Hard Brexit Scenario. They may appear to be overdramatic. Compared with the recent past they may be thought relatively modest. It is also the case that relatively modest assumed changes at the macro level are associated with much wider set of outcomes for individual sectors. Hopefully the more severe scenarios will not come to pass. However, since embarking on these analyses, the odds of the Brexit negotiations ending in a “train wreck” have shortened. What seemed earlier as an extreme assumption, begins to look more likely with every passing day.
Scenarios
Three scenarios, in addition to the “static” costs associated with the tariff imposition (Scenario A), are shown below.
The basic assumptions and main outcomes (at the macro level) are shown in chart 10 below. The figures refer to percentage changes to that part of final demand from 2014 levels shown in the UK WIOD table. The scenarios consist of declines in final demand, occurring at different rates according to each section of final demand. The figures refer to an expected percentage change in each final demand component, normally expected to occur over one year. The outcomes compare the scenario gross output levels compared with the base line situation, or status quo achieved in 2014.
Chart 10
| Scenario Number | A | 1 | 2 | 3 | ||
| Scenario Title | Gross Trade Tariff Burden SCENARIO 0 | Short Sharp Knock SCENARIO1 | Longer, slower response SCENARIO 2 | Slow Growth in sectors with High IIT index SCENARIO 3 | ||
| Component of Final Demand | ||||||
| Number of years forecast | 1 | 1 | 5 | 1 | ||
| Private Household Consumption % Change | 0 | -4 | -2 | -8 | ||
| Non profit Instit %Change | 0 | -3.9 | -2 | -8 | ||
| Government Consumption % Change | 0 | -2 | 0 | -5 | ||
| Gross Fixed Capital Formation (investment) % Change | 0 | -5 | -3 | -15 | ||
| % Change in Inventories | 0 | 0 | 0 | -3 | ||
| Exports % change | 0 | -5 | -2 | -15 | ||
| Other | Reduction in Final Demand by amount of tariff burden only | Changes packed into one year | Smaller initial changes continued for longer | Demand falls only in sectors exposed to international trade | ||
| Effective overall change in Final Demand | 0 | -0.52 | -3.5 | -6.8 | ||
| Result: Estimated Change in gross output | -0.78% | -6.2% | -9.2% | -11.60% | ||
Chart 10 details the inputs and assumptions needed for the scenarios. Regional details are shown in the individual sections on the different scenarios.
Readers are reminded that these scenarios act as bridge between the “consensus” view on Brexit elaborated in many economic studies in 2016, documented in Black (2017a). The scenarios shown here are all consistent with the “envelope” of results cited by other authors. What is made more explicit here are the paths towards achieving a given outcome, by referring to specific assumptions about the components of final demand.
A summary of the scenario effects is shown below.
Scenario A (Base line) is the simplest. The combined effects, post Brexit, of the tariff burdens have been deducted from final demand. This results in a decline in gross output of just over three quarter of one percent. This confirms earlier remarks that the direct impact of the tariff imposition, at the macro level, will be slight. It has already been shown that when looked at in terms of individual sectors, the tariff impact will be more varied than this.
Scenario 1 considers a “short sharp shock”, with larger declines in final demand over one year. Drops in final demand from private households, investment and exports of around 5% are assumed. There is also a continuation of government austerity, with a drop in government demand of 2%. This, and the following scenarios include the indirect ripple effects on the rest of the economy. Scenario 1 leads to a 6% drop in gross output.
Scenario 2 considers a smaller annual but lengthier adjustment over five years. The most seriously affected part of final demand is investment (-3%). The consequences of the lengthier recession are more severe leading to a drop in UK gross output of just over 6%
Scenario 3 combines more serious demand reductions in household, government, investment demand, and exports, with a restriction of Brexit trade costs to those sectors with high values of an Intra-Industry Trade Index[16]. This identifies industries highly integrated into the world/EU economy.
The regional consequences all follow from the macro assumptions made in the respective scenarios. [17]
Scenario A Impact of the Tariff Burden
This scenario is relatively simple. The imposition of tariffs on both imports and exports, post Brexit, will increase costs considerably for some sectors. Chart 11 looks how the imposition of these costs then affects other sectors in the economy.
As can be seen, although the imposition of additional trade costs is relatively minor, this still has quite large multiplier or ripple effects on other parts of the economy. In this scenario, textiles, transport equipment, rubber, food processing electrical equipment and agriculture are the main sectors negatively affected. These sectors would experience losses in gross output of between two and five percent. These output reductions form a higher proportion of sector value added.
Chart 11

The red bars identify the service sectors affected, and as can be seen they come lower down the list with potential output losses of less than two percent.
The regional situation shown in chart 12 below demonstrates that Scotland will be the most negatively affected region, followed by Yorkshire & Humberside, and then by the North East. All of these regions suffer output losses greater than the national average. The sectors that come out relatively unscathed, owing to the predominance of service industries, are London, England as a whole and the South East.
For those thinking that this gives a hard Brexit a clean bill of health, it should be added that our treatment of services has been lenient. And the broad assumption that nothing else changes at the macro level is clearly inappropriate. Even before Brexit has officially started, the Bank of England lowered short term policy rates to 0.25%, a historical low, and as discussed earlier, the external value of the pound sterling has fallen by 15%, both of which might be regarded as “expansionary”. Despite this, GDP growth in quarter 2, 2017, was revised down to 1.5%, its lowest rate since 2013.
Chart 12
Scenario 1: “Short Sharp Knock”
Scenario 1 consists of a short sharp knock, with the changes being experienced over a one year period. The overall average reduction in final demand is -3.6%, and this results in a drop of output of 6.2% for the economy as a whole. The scenario involves steeper reductions in final demand of around 4 to 5% by FD category. This also includes a tightening of austerity, with a further 2% drop in government consumption. This represents a fairly ugly scenario, and one that it would be better to avoid.
The sector outcomes are shown in chart 13. The “usual” suspects of textiles, transport equipment and rubber are there. Chemicals, machinery and basic metals are placed higher than in the earlier scenario. The losses these sectors might experience are between 8 and 10% of gross output.
Chart 13 Scenario 1: Impact on Sector Gross Output. Red bars refer to service sectors. Ranked by size of effect

Looking lower down the list, some of the important service sectors (marked in red) could experience output falls of between 5 and 6%, including Professional services, administration and support, and finance. The sectors most unscathed are Education, Health and Public administration.
The regional outcomes in scenario 1 look dramatically different from the previous scenario. Chart 14 shows that the West and East Midlands are now the most negatively affected. This is due both to the vulnerability of the motor industry and transportation equipment, as well as how the recessionary effects are spreading across to other parts of industry. This is followed by the North West.
The chart shows that the blue “Leave” regions are clearing suffering more than other parts of the economy in scenario 1. Scotland and Northern Ireland perform less well than the UK overall, but have slipped down the list. The West Midlands would expect to suffer a near 5% reduction in gross output in this scenario. And this might be something that any government or central bank should consider when contemplating tightening fiscal policy (as is the case here), or through raising interest rates as in the case of the central bank.
Chart 14

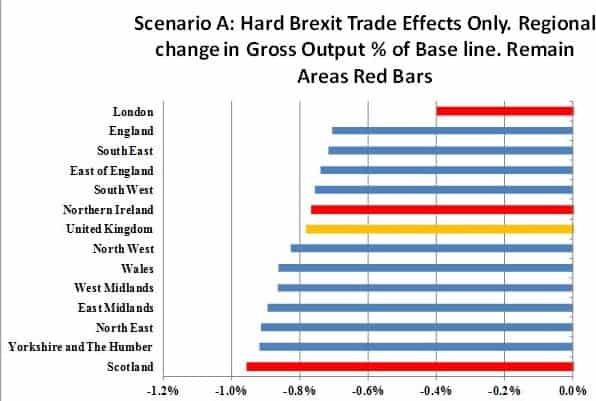
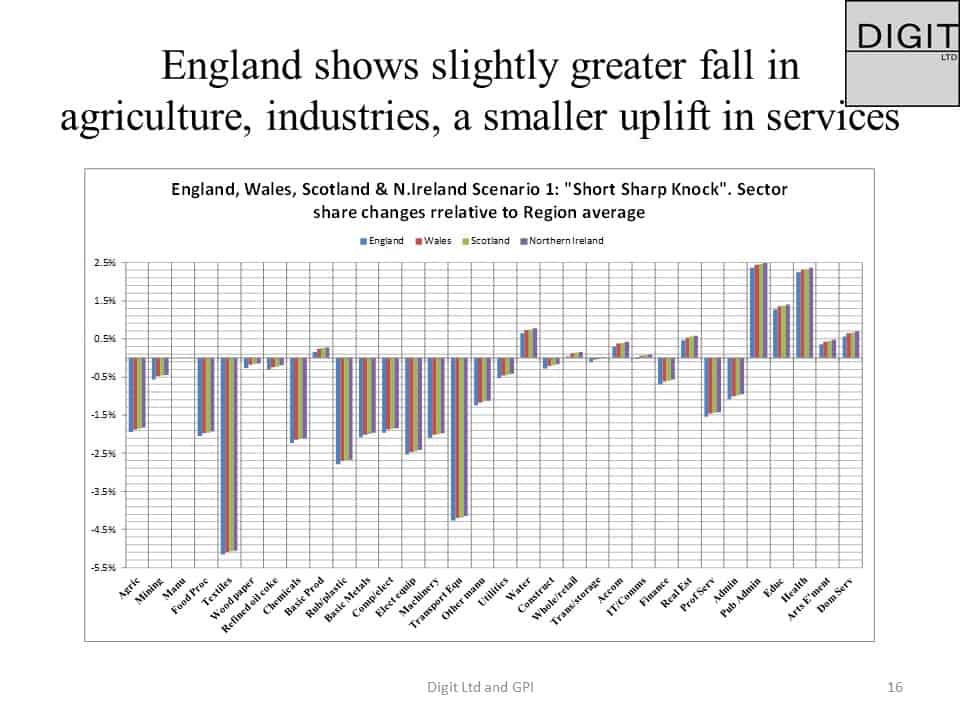
Chart 15 below shows how the overall shares in gross output for each sector in England, Scotland and Wales change as a result of Scenario 1. Broadly speaking the shares of industrial sectors in the three regions are declining. This pattern is slightly stronger in England than in other countries. England is “de-industrializing” faster than the others.
The chart shows that there is a gradual shift taking place towards service sectors, and this is occurring marginally more quickly in Northern Ireland than elsewhere. This is a “snapshot” of a longer term trend. And as can be seen there is some variation between sectors. But without wishing to over-interpret the chart, it provides some evidence that Brexit plus associated disturbances could provide a further push towards services and away from manufacturing. Quite possibly an unintended consequence of a hard Brexit “event”.
Chart 15
Scenario 2: Longer, slower losses over a 5 year period.
This scenario involves a less dramatic reduction in final demand on an annual basis. This continues for 5 years. The outcomes examine the cumulative impacts of the scenario over this period. It shows what happens when deeper structural issues are not corrected, and negative trends, once begun, are not reversed.
Sceptics might also want to consider the following. In the past it has always been a “fundamental” assumption that western economies would continue to grow, and this would be an outcome of sustained increases in productivity. The recent past has shown this to be entirely incorrect. For reasons that are still obscure, measured productivity has flat lined more or less continuously since the Great Financial Crisis. This is not part of any economics “text book” view of how a modern economy is supposed to work.[18]
The consequences of this though are quite severe, as the charts below show, even though there are no explicit reductions in government spending factored in. The sharpest fall in final demand comes from reductions in gross fixed investment, which continues over the entire time period.
Chart 16

Chart 16 shows that the extent of sector decline broadens and deepens. Even the least affected sector loses 2% of gross output. The most affected are now experiencing falls of between 6 and 9%. Professional services, administration and finance have also moved up the table. experiencing losses of between 6 and 7%.
As the service sectors get sucked into the general decline the regional picture alters. Chart 17 shows that while the West and East Midlands remain the most negatively affected regions, the position of both the South East and London deteriorates. Scotland and Northern Ireland, by contrast are now declining less rapidly than the national average. And Wales is the least negatively affected of the regions. Once again, the “Leave” areas of the country suffer more than the “Remain” regions.
Chart 17

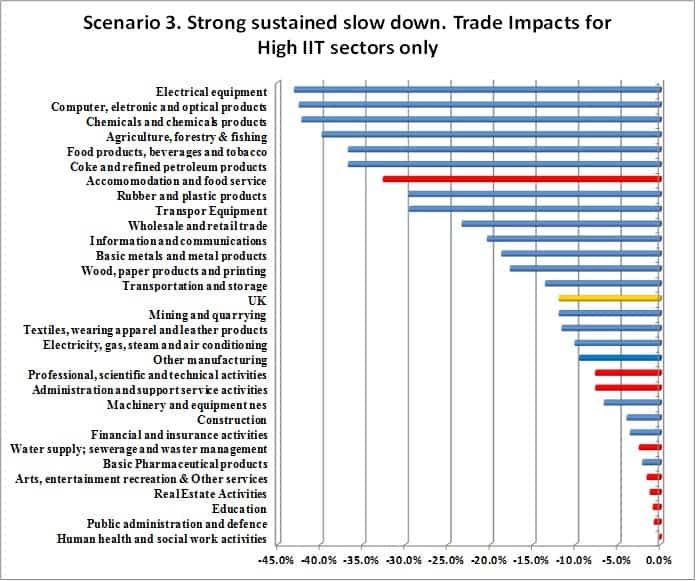
Scenario 3: Slow Growth in sectors with High IIT index
Scenario 3 represents something of a crisis, ameliorated by only including the trade effects of those sectors with a high inter-industry trade index value. These industries are ones that are highly integrated into the global/EU economy, with large proportions of exports and imports in their activities. The macro dimensions otherwise look extremely depressing, although the good news is that only lasts for one year. Even so this sets off a radical reduction in those sectors most exposed to foreign trade, where output declines of between 40 and 45% could occur.
As the manufacturing sector basically collapses, so the service sector remains “relatively” lightly affected. This still translates into expected output losses of between 5 and 10%, which in the other scenarios represented extreme values. Here the main shelter from the storm is in health, education and public administration (see Chart 18).
Chart 18
The regional consequences, shown in Chart 19, of this are uniformly bad, with regional output declining by between 10 and nearly 16%. The worst affected region is Northern Ireland, a Remain area, followed by the East Midlands and the North West. The West Midlands is overtaken by others experiencing even more output falls. Scotland comes in the middle of the pack, with a 14% decline, somewhat worse than the national average. The South East, England as a whole, and London are the most resilient in this scenario.
Chart 19

Conclusions
The scenarios show a variety of outcomes depending on the severity of the input assumptions. On the basis of negative, but not altogether extreme input assumptions, variations in output drops between three quarters of one percent of gross output to 11.6% in the case of scenario 3 could accur. Sector variations range between maximum output reductions between 5% and 40% depending on the scenario.
There is a certain consistency in the sector results, with Transportation Equipment, Textiles, Rubber/Plastic, Chemicals and Electrical Equipment consistently being the most badly effected by output reductions.
Chart 20: National Rankings By Scenario. A low number means a high ranking. UK average rank shown for reference.
| Scenario Number | Scotland | Wales | Northern Ireland | UK |
| A Trade Effects only | 1 | 6 | 7 | 8 |
| 1: Short Sharp Knock | 5 | 6 | 4 | 9 |
| 2Gradual Longer | 9 | 14 | 12 | 8 |
| 3 High trade dependency Sectors | 8 | 6 | 1 | 11 |
The regional results show consistency too. The most badly affected regions are the West and East Midlands, the North West, Regions such as London, the South East and South West are never the worst affected. The scenario impacts of the other nations are shown in chart 20.
Scotland is the most negatively affected in Scenario A. It is in 5th position in scenario 1, and thereafter drops out of the top 5, being less negatively affected than the national average. Wales is never in the five worst affected regions, yet is always more seriously affected than the national average. Northern Ireland is in the top 5 for scenario 1, and is the worst affected in scenario 3[19].
More broadly speaking, England as a combined area is never the most badly affected, and is not in the top 5. London and the South East rarely do worse than the national average, and are frequently the least affected areas. It is only when the recession continues for longer that a tipping point is reached, and the decline in service sector output starts to pull down London and the South East.
The broader implications of the analysis are that:
- Manufacturing industries are more likely to be negatively affected by a Hard Brexit than service sectors.
- Some of these sectors are relatively small. Since they are regionally concentrated, their discomfort tends to affect regions in the Midlands and North more consistently than other areas.
- Service sectors are not the most exposed to a Hard Brexit. This evaluation could change though were access to the EU market to be completely blocked. Under these circumstances the ordering of the worst affected regions would change dramatically.
- This underlines just how important reaching an agreement with the EU will be, and how preferable membership of the EU is. Becoming a member of the EEA, with continuing tariff free access to the EU market, would be preferable to a WTO solution.
- Those areas that voted most strongly to leave the EU suffer the most for it. A cruel outcome for voters who had no idea that this might be a result of their voting decision. It is tempting to think that had these possibilities been more widely explained, many might have changed their minds.
- While those in the South and London may take some comfort from their relatively assured position, this is critically dependent on assumptions on service sector trade.
There appears to be a closer correlation between voting patterns and economic interests in two of the Remain areas, London and Northern Ireland, and fairly strong correlation for Scotland too. There is virtually no overlap between the political logic in the Leave regions and their economic interests. It looks strongly as if voters there, either intentionally, or unintentionally, decided to put their economic future at risk by voting to Leave the EU.
APPENDIX 1
Services form an important part of the UK economy. Yet, they are generally neglected by policy makers. And this has been conspicuously true for the discussion on the impact of Hard Brexit on services.
The difficulty is that there are no tariffs on international trade in services. This though does not mean that there is anything like free trade in service sectors. Even in the EU it took many years of patient negotiation before a number of key principles could be introduced that eased non tariff barriers in the trade in services within the EU.
The main steps forward were in the mutual recognition of professional standards. Thus it was accepted that a doctor who qualified in one EU country could apply for a job as a doctor in another EU country. Yes, there would be some additional tests, for example around language, and/or around local laws and customs. But there was no further challenge to the right of a doctor to practice as a doctor in another EU country.
The same is also true for professions such as accountancy and law. Again, with the qualification that an auditor, for instance, may need to pass a specific local exam, in order to prepare accounts for a specific GAAP[20] system. If a client reports according to the IFRS[21], then most accountants will be able to do this work irrespective of their origin. But not all accountants can sign off on accounts in a local member state GAAP.
For lawyers a similar situation can also be found. In specific areas of national law, it may be necessary to pass a specific exam. This being true for nationals, as well as for EU “immigrants”.
In other service industries the non tariff barriers are more related to market access. This involves “passporting” of access rights. If a financial product meets a number of technical requirements and conforms with agreed rules, then it gains a “passport”, and can be sold across the whole EU. This is true for financial services, and retail financial service products. Where a product or service conforms to EU rules, e.g. UCITS, then the purveyor of the product/service can sell it anywhere within the EU, creating a larger potential market for the product/service. Withdrawal and the loss of these passporting rights will greatly reduce the potential size of the market for new suppliers.
In practice, it may well be that most financial products sold in a given EU member state are sourced from that country as well. But with differences in tax rates between member states, certain activities, such as portfolio management, have concentrated in countries such as Luxemburg, Ireland, the Netherlands and in the UK. This is independent of the use of offshore tax havens, many of which are associated with their former colonial powers, now member states in the EU[22].
In the absence of further clarification about future trade relations between the UK and the EU, one can only make a stab at assessing the likely impact of a Hard Brexit on services. The difficulty is increased since the kind of reductions to be expected will be large compared with the likely tariff based effects. Hence, decisions about the strength of non tariff barriers will have a strong impact on the overall results of the IO analysis.
Table A1 Expected Size of impact of non tariff barriers on UK service industries (SIC07)
Following a “Hard Brexit” I/O classification system
| SIC Classification | Sector Name | Factors | Overall Assessment | Quantitative Change in FD% |
| H | Transport & Storage | Reduced trade volumes –;more bureaucracy+; more delays+; higher costs + | No change | |
| I | Accommodation | Reduced tourism-; reduced immigration-; lower GBP raises P competitiveness | – | -5 |
| J | Information & Communications | EU data sharing rules-;less EU investment-;more global comms +;intellectual property protection ? | No Change | 0 |
| K | Finance & Insurance | Passporting –; retail –;de-regulation ??; | – | -5 to -10 |
| L | Real Estate | Reduced immigration–;higher emigration – | – | -5 |
| M | Professional, scientific, technical | Passporting–; lack of mutual recognition–; lack of ECJ cover-;lack of labour mobility– | — | -10 |
| N | Admin/Support/HQ activity | HQ functions reduced -; lower foreign investment-; | – | -5 |
| O | Public administration, defence, soc security | Increase in regulation++; Defence increase (budget dependent)?; lower GBP, imports more expensive -; import substitution+; | + | +5 |
| P | Education | Reduced Erasmus–;reduced EU R&D–; ;lower immigration | — | -10 |
| Q | Health/Social Care | Less immigration -;fewer doctors-; more elderly | No change | 0 |
| R_S | Art/Entertainment/Recreation, other services | Less EU cooperation -; less in London -; budget dependent ? | – | -5 |
| T | Household Activities | Lower immigration-; lower household incomes- | = | -5 |
Table A1 provides a necessarily superficial view of what is a very complex situation. The gist of it is that the UK has cooperated closely with the EU in many service areas over the last 40 years. Furthermore, the English language has been a powerful magnet attracting a host of arbitration services employing lawyers and accountants to deal with EU related matters. Frequently UK legal and accounting systems may also be chosen for convenience, and to take advantage of the open nature of the financial market for equities and insurance. A lot of this business has benefited from being “frictionless”, together with relatively light regulation. UK governance standards are considered good and reliable, and the combination of this, plus working within the EU legal space under the remit of the ECJ was a further big benefit.
Many of these advantages will either disappear or be much reduced in scope following a Hard Brexit. And there is no way, given the length and difficulty of individual bilateral trade negotiations within the WTO framework, that much of this can be easily substituted in the short term, and even less within either a Article 50 negotiation period and any likely transitional period thereafter.
Moreover, many of the service providers are themselves relatively mobile. Those most threatened by uncertainties around Brexit and possible loss of market access may well emigrate themselves, and set up local offices within the EU, rather than servicing demand from a UK location as at present.
This can work in the other direction as well. Financial service providers from the EU may well want to continue to access the London financial markets. If necessary through the establishment of new UK base subsidiaries, with their own capital base in the UK. This will add to the cost of doing business in London, reduce returns on assets/equity, yet may be necessary for other commercial reasons.
Attention has been focussed on the financial markets. It seems that the main negative impacts of a Hard Brexit will be felt less there, and more in other less obvious parts of the UK’s service economy.
APPENDIX 2
This shows the post Hard Brexit tariff and non-tariff barrier trade effects following the introduction of tariffs on UK trade with the EU using the 33aggregated sector approach.
| 33X1 | Sector Names | TOTAL TRADE EFFECTS INC NTBS US$ mill | |||
| A | Agriculture, forestry & fishing | 521.40 | |||
| B | Mining and quarrying | 9.34 | |||
| C | Manufacturing | 0.00 | |||
| CA | Food products, beverages and tobacco | 2,446.00 | |||
| CB | Textiles, wearing apparel and leather products | 863.73 | |||
| CC | Wood, paper products and printing | 59.00 | |||
| CD | Coke and refined petroleum products | 147.32 | |||
| CE | Chemicals and chemicals products | 787.40 | |||
| CF | Basic Pharmaceutical products | 0.00 | |||
| CG | Rubber and plastic products | 662.60 | |||
| CH | Basic metals and metal products | 1,332.93 | |||
| CI | Computer, electronic and optical products | 665.22 | |||
| CJ | Electrical equipment | 421.09 | |||
| CK | Machinery and equipment nes | 742.05 | |||
| CL | Transport Equipment | 4,792.04 | |||
| CM | Other manufacturing | 141.37 | |||
| D | Electricity, gas, steam and air conditioning | 405.49 | |||
| E | Water supply; sewerage and waste management | 0.00 | |||
| F | Construction | 0.00 | |||
| G | Wholesale and retail trade | 0.00 | |||
| H | Transportation and storage | 0.00 | |||
| I | Accommodation and food service | 279.96 | |||
| J | Information and communications | 0.00 | |||
| K | Financial and insurance activities | 2,783.61 | |||
| L | Real Estate Activities | 189.13 | |||
| M | Professional, scientific and technical activities | 3,658.19 | |||
| N | Administration and support service activities | 1,791.95 | |||
| O | Public administration and defence | -497.13 | |||
| P | Education | 444.53 | |||
| Q | Human health and social work activities | 0.00 | |||
| R_S | Arts, entertainment recreation & Other services | 409.19 | |||
| T | Activities of households | 0.00 | |||
| CONS_h | Final consumption expenditure by households | 6,645.29 | |||
| CONS_np | Final consumption expenditure by nonprofit organisations serving households (NPISH) | 38.28 | |||
| CONS_g | Final consumption expenditure by government | 21.67 | |||
| GFCF | Gross fixed capital formation | 2,132.64 | |||
| INVEN | Changes in inventories and valuables | 127.90 | |||
References
Baldwin, Richard, ed: “Brexit Beckons: Thinking ahead by leading economists”, VoxEU, August 2016; http://voxeu.org/content/brexit-beckons-thinking-ahead-leading-economists
Black, Andrew, et al: “Hard Brexit, International Trade and the WTO Scenario”, Federal Trust, May 2017a
Booth, Stephen; Howarth, Christopher; Persson, Mats; Ruparel, Raoul; Swidlicki, Pawel: “What if… the consequences, challenges and opportunities facing Britain outside of the EU, Open Europe, 2015, http://europas-krisen.zdf.de/media/downloads/Brexit/150507-Open-Europe-What-If-Report-Final-Digital-Copy.pdf
Busch, Berthold; Matthes, Jügen: “Brexit – The Economic Impact, A Meta-Analysis”, Cologne Institute for Economic Research, April 2016; https://www.iwkoeln.de/en/_storage/asset/…/Brexit_meta_study_IW_report.pdf
Campos, Coricelli, Moretti. “Economic Growth and Political Integration”, 2014, anon-ftp.iza.org/dp8162.pdf
Ciuriak et al, “The Trade Related Impact of a UK exit from the EU Single Market” Ciuriak Consulting, 2015, https://papers.ssrn.com/sol3/papers.cfm?abstract_id=2620718
Congdon, Tim: “How Much Does the EU cost Britain”, UKIP, 2012, www.timcongdon4ukip.com/docs/EU2014.pdf
Dhingra, S; Ottaviano, G, Simpson, T; Van Reenen, J: “The Consequences of Brexit for UK Trade and Living Standards”, Centre for Economic Performance, LSE, 2016, http://cep.lse.ac.uk/pubs/download/brexit02.pdf
Dhingra, Swati ; Sampson, Thomas: “Life after Brexit: What are the UK’s options outside the European Union?”, The Centre for Economic Performance, CEP, LSE, http://cep.lse.ac.uk/pubs/download/brexit01.pdf
Eurostat, Eurostat Manual of Supply, Use and Input-Output Tables, 2008 edition, ISSN 1977-0375, http://ec.europa.eu/eurostat/documents/3859598/5902113/KS-RA-07-013-EN.PDF/b0b3d71e-3930-4442-94be-70b36cea9b39?version=1.0
Gasiorek, “The Accession of the UK to the EU. A Welfare Analysis”, Wiley, 2002, http://onlinelibrary.wiley.com/doi/10.1111/1468-5965.00363/abstract
GED study: “”Costs and benefits of a United Kingdom exit from the European Union ; Bertelsmann Stiftung, 2015, https://www.bertelsmann-stiftung.de/fileadmin/files/BSt/Publikationen/GrauePublikationen/NW_BREXIT_EN.pdf
HM Treasury analysis, “The long-term economic impact of EU membership and the alternatives” https://www.gov.uk/government/uploads/system/uploads/attachment_data/file/517415/treasury_analysis_economic_impact_of_eu_membership_web.pdf
House of Commons Library, “”Brexit: impact across policy areas”, Briefing Paper Number 07213, August 2016 ; http://blogs.law.columbia.edu/future-of-integration-conference/files/2016/08/CBP-7213.pdf
Ilzkovitz, “Steps towards a deeper Economic Integration: the internal market in the 21st century, 2007, ec.europa.eu/economy_finance/publications/pages/publication784_en.pdf
IMF: “United Kingdom, Selected Issues”, June 2016, https://www.imf.org/external/pubs/ft/scr/2016/cr16169.pdf
Jackson, James K.; Ilias Akhtar, Shayerah; Mix, Derek E.: “”Economic Implications of a United Kingdom Exit from the European Union ; Congressional Research Service”, July 2016, https://fas.org/sgp/crs/row/R44559.pdf
Kosaka, Hiroyuki; Yano , Takashi: “An International Input-Output Analysis on the Effects of Free Trade Agreements in Asia” EcoMod 2004, International Conference on Policy Modeling, June 30-July 2, 2004, Paris, France, https://ecomod.net/sites/default/files/document-conference/ecomod2004/103.pdf.
Ledda; Mattei, F.; Penteriani, S.:” The Use of Input-Output Analysis for the Evaluation of the Macroeconomic Impact of Electricity Tariffs Policy”, http://www.sascommunity.org/seugi/SEUGI1990/The%20Use%20of%20Input-Output%20Analysis%20for%20the%20Evaluation%20of%20Macroeconomic%20Impact%20of%20Electricity%20Tariffs%20Policy%20A%20Menu%20Driven%20System.pdf
Lee, Daniel; Leach, Anna: “CBI Literature review of the impact of EU membership on the UK economy”, February 2017, http://www.cbi.org.uk/business-issues/uk-and-the-european-union/eu-business-facts/cbi-literature-review-of-the-impact-of-eu-membership-on-the-uk-economy-pdf/www.cbi.org.uk
Lee, Gene K.; Schluter, Gerald E.: “The Effects Of Real Multiplier Versus Relative Price Changes On Output And Income Generation In Input-Output Models” Agricultural Economics Research 1 Vol. 29, No. 1, January 1977, http://ageconsearch.umn.edu/record/147775
Lyons, Gerard: “The Europe Report: A Win-Win Situation”, GLA, August 2014, https://www.london.gov.uk/sites/default/files/gla…files…/europe_report_2014_08.pdf
Mansfield, Iain: “”A Blueprint for Britain: Openness not Isolation””, Institute of Economic Affairs, April 2014; https://iea.org.uk/wp-content/uploads/2016/07/Brexit%20Entry%20170_final_bio_web.pdf
Milne, Ian: “A cost too far: an Analysis of the net costs and benefits for the UK of EU membership”, 2004, www.civitas.org.uk/pdf/cs37.pdf
Minford, Patrick: “”Measuring the Economic Costs and Benefits of the EU ; Open Economies Review, Volume 17, Issue 4, pp 509–524, December 2006, https://link.springer.com/article/10.1007/s11079-006-0362-x
OECD, “The Economic Consequences Of Brexit: A Taxing Decision”, 2016. https://www.oecd.org/eco/The-Economic-consequences-of-Brexit-27-april-2016.pdf
Office of Budget Responsibility, “Economic and Fiscal Outlook”, March 2017, http://budgetresponsibility.org.uk/efo/economic-fiscal-outlook-march-2017/
Ottaviano, Gianmarco; Pessoa, Joao Paulo; Sampson, Thomas: “The Costs and Benefits of Leaving the EU, LSE May 13, 2014, http://cep.lse.ac.uk/pubs/download/pa016_tech.pdf
Paine, Young: “The Macroeconomic Impact of UK withdrawal from the EU”, 2004, www.niesr.ac.uk/sites/default/files/…/1-s2.0-S0264999302000688-main.pdf
Park, Ji Young: “Application of a Price-Sensitive Supply-Side Input-Output Model to an Examination of the Economic Impacts: The Hurricane Katrina and Rita Disruptions of the U.S. Oil-Industry”, January 2009, Ecological Economics, https://www.researchgate.net/publication/239823945_Application_of_a_Price-Sensitive_Supply-Side_Input-Output_Model_to_an_Examination_of_the_Economic_Impacts_The_Hurricane_Katrina_and_Rita_Disruptions_of_the_US_Oil-Industry
PwC, commissioned by CBI: “Leaving the EU, implications for the UK economy”, 2016, https://www.pwc.co.uk/economic-services/assets/leaving-the-eu-implications-for-the-uk-economy.pdf
Schoof, Ulrich: “Costs and Benefits of a UK exit from the European Union”, Bertelsmann Stiftung, 2015, https://www.bertelsmann-stiftung.de/en/publications/publication/did/costs-and-benefits-of-a-united-kingdom-exit-from-the-european-union/
Slaughter and May: “Brexit essentials: Alternatives to EU membership” , Briefing, January 2016; https://www.slaughterandmay.com/media/2535258/brexit-essentials-alternatives-to-eu-membership.pdf
Steinberg, J:”Brexit and the Macro Economic Impact of Trade Policy Uncertainty”, University of Toronto, May 2017, https://www.economics.utoronto.ca/steinberg/files/brexit.pdf
Swinbank, Alan: World Trade Rules And The Policy Options For British Agriculture Post-Brexit, Briefing Paper 7, UK Trade Policy Observatory, University of Sussex, January 2017, https://www.sussex.ac.uk/webteam/gateway/file.php?name=briefing-paper-7-final.pdf&site=18
Wang, Jian; Charles, Michael B.: “IO Based Impact Analysis: A Method for Estimating the Economic Impacts by Different Transport Infrastructure Investments in Australia, 2010, CRC for Rail Innovation / Southern Cross University, http://atrf.info/papers/2010/2010_Wang_Charles.pdf
Endnotes
[1] For further information on this, please see Appendix 1 below, and Black A (2017a) p 6 and chart 5.
[2] Black (2017a), chart 2, page 4.
[3] Details are shown in Appendix 2.
[4] See Lydia Smith, “Trump Administration rejects Theresa May’s post Brexit agricultural deal with EU”. Independent, October 6 2017.
[5] For example, the recent EU-Canada trade deal; abortive efforts between the US and Asian Pacific countries (Trans-Pacific Partnership (TPP), or the Trans Pacific Partnership Agreement (TPPA), and the US and the EU TTIP (Transatlantic Trade and Investment Partnership). All of which have been thrown into doubt by the accession of Donald Trump to the US presidency.
[6] In complete contrast to Brexiteers who falsely claim that being outside of the EU gives back “control” to the UK government when the opposite is the case.
[7] NUTS = Nomenclature of Territorial Units for Statistics. This is agreed with Eurostat. There are three levels of disaggregation for regional economic and social statistics. NUTS 1 is the highest level of aggregation, down to NUTS3 which is highly disaggregated.
[8] The Barnett formula is essentially a population weighted approach for distributing new Treasury funds to Wales, Scotland and Northern Ireland. It remains contentious, particularly between Westminster and Edinburgh. Dis-satisfaction with the formula amongst the recipients is one factor driving the desire for more devolution, and in Scotland’s case, a desire for independence.
[9] This means that the results are not directly comparable with the previous paper Black(2017a).
[10] See Chart 1 for the NUTS1 regions in the United Kingdom.
[11] Gross Output = final output (goods/services consumed) plus intermediate output (goods and services used to produce other goods and services). This is not the same as GVA, and it differs from GDP measures. Gross output information is obtained from the Input-Output tables. Details of trade cost estimations (tariffs) are in appendix 2. Details for non tariff barriers can be found in appendix 1
[12] Currently flatlining since the Great Financial Crisis.
[13] On the grounds that some 19% of final consumption is made up of imports, and investment will reflect reduced prospects of selling into the larger EU export market.
[14] This introduces something of a dichotomy. There may be Brexit outcomes favourable for individual businesses, while being unfavourable for the UK as a whole.
[15] Despite financing/leasing costs available on very favourable terms.
[16] For a definition of the IIT index see p. 29.
[17] Readers are reminded that for this analysis a 33×33 matrix was used, ensuring compatibility between the ONS regional data and the data used in the input output tables. This means that some of the specific sector results will differ from those in Black (2017a).
[18] See recent OBR downward revisions in productivity for the forthcoming 2017/8 UK budget.
[19] Suggesting that the recent imposition of 300% tariffs by the US “ally” on Bombardier’s operations will affect Northern Ireland hard, even before Brexit has officially begun.
[20] Generally Agreed Accounting Principles (GAAP)
[21] International Financial Reporting System (IFRS)
[22] The main countries with tax haven dependencies are the Netherlands and the UK. France treats its overseas territories as being departments of metropolitan France – so no tax havens there.