“Hard Brexit”, International Trade and the WTO Scenario
May 2017
With the assistance of Etienne Piciocchi and Michael Spracklin
Click here to download the paper in pdf format.
Executive Summary
This report looks at the possible consequences of a hard Brexit, following an unsuccessful conclusion of Article 50 negotiations between Britain and the European Union. On its departure from the EU, Britain would presumably adopt the EU’s current “Schedule of Concessions” agreed at the World Trade Organization. This would involve imposing tariffs by the EU on UK exports, and the UK will in turn impose tariffs on imports from the EU. This report provides estimates of what these “tariff” costs are likely to be. These are then used to examine the “ripple” effects through the rest of the economy using Input-Output analysis. This is a powerful analytical approach well suited to exploring the sector impacts of economic policy changes.
The results of four different Brexit related scenarios are shown below. The scenarios start out narrowly by just considering trade impacts, and are then extended to include broader changes in demand.
- Scenario 0, looking solely at the impact of the “tariff burden” effects suggests that the direct effects of this post Brexit imposition will reduce overall gross output by around 0.5%. Some individual sectors experience output reductions of around 5%
- Scenario 1 considers a larger, but time limited “short sharp shock” to the UK economy as part of failed Brexit negotiations. The overall output loss is estimated at around 5%.
- Scenario 2 considers a more gradual but medium term reduction in final demand estimating that there could be an overall drop in output of over 8%.
- Scenario 3 shows the impact of a more serious Brexit induced recession, led by drops in private consumption and investment. This could have far wider effects, and lead to an average output reduction of over 10%. For some sectors this could lead to reductions of nearly 25% in output.
The report looks in detail at how the hard Brexit scenarios affect the 55 sectors of the economy. The most affected sectors show output reduction substantially greater than the “average” rate for the economy as a whole. The following sectors appear as being the most vulnerable to a hard Brexit in most of the scenarios are:
- Motor Vehicles
- Fishing and Agriculture
- Basic Metals
- Oil refining
- Other Transport equipment
- Food products, beverages and tobacco
- Textiles
- Rubber/plastic
- Chemicals
- Scientific Research
- Computer manufacture
- Construction
- Architecture & engineering
- Computer Programming
- Real Estate
When the trade effects are compared to the size of sector value added, (the sum of payments to labour and profits) there are five sectors where this is greater than 10%. This could be the equivalent of reducing the profitability of foreign trade in these sectors to zero. The sectors affected are:
- Motor Vehicles
- Basic Metals
- Fishing/aquaculture
- Other transport (aerospace)
- Textiles
The results shown here exclude the effects of the imposition of non-tariff barriers (NTB). These relate to rules around product safety and quality, “passporting” rights of market access, the mutual recognition of professional qualifications, and processes. There are wide variations in the estimate of non tariff barriers. Although they are not explicitly considered here, it would be reasonable to add at least 2 to 3% further reductions in output, in addition to those already mentioned, as arising from a hard Brexit. These will have a powerful impact on the service sector that does not face specific tariff barriers as a result of a hard Brexit.
Claims that a post Brexit world will lead to a dynamic surge in British exports have been found wanting. Tariff protection in many of the world’s fastest growing markets, the BRICS and in Asia are substantially higher than with the EU. NTBs are even higher. The scale of success needed in these markets to make good a 10% reduction in exports to the EU looks improbably high, and is unlikely to be achieved in the near future.
These conclusions suggest that it is in the national interest to secure a “good deal” on Brexit, and it contradicts any assertion that “No deal is better than a bad deal”. It also helps to fill a gap admitted by the Minister for Brexit, Mr David Davis, that no contemporary modeling of the consequences of a hard Brexit has been undertaken.
Contents
Executive Summary
Introduction
Significance of the EU as a source of Imports
Significance of non tariff barriers
Estimating the Costs of Trading after a hard Brexit
International Supply Chains
Trade Burden Estimates (tariff costs)
Other Features of UK International Trade
Trade Burden and Value Added
Economic and Trade Scenarios using an Input-Output approach
Scenarios
Scenario 0 Impact of the Tariff Burden
Scenario 1 “Short, Sharp Knock”
Scenario 2: Slow and Sustained losses over a 5 year period
Scenario 3: Decline limited to Highly Internationally Integrated Sectors
Conclusion
References
“I hope I’m wrong to think that Britain has made a choice that will have very bad consequences, because I don’t wish disaster on my country. But among the things to fear is what happens when the millions of poorer Britons who were seduced by the Brexiters discover that it is not the miracle solution to their discontents that they were promised”.
Andrew Rawnsley, leading commentator for The Observer, in Brexit: a journey into the unknown for a country never before so divided
Introduction
In the lead up to the Brexit referendum in June 2016, much analysis was conducted about the possible effects of Britain leaving the EU. Chart 1 compares expected outcomes following a “hard Brexit”, described elsewhere as the WTO option or as the “Albanian” option, reflecting the current status Albania has with the EU.
Over and above any technical/economic difficulties in peering into such an uncertain future, the forecasters were clearly politically influenced, with one group of forecasters participating in what became known as “Project Fear”, as the then government was keen to stress the costs of leaving, while the Eurosceptic Brexiteers were equally keen to stress the estimated benefits from leaving the EU.
Chart 1
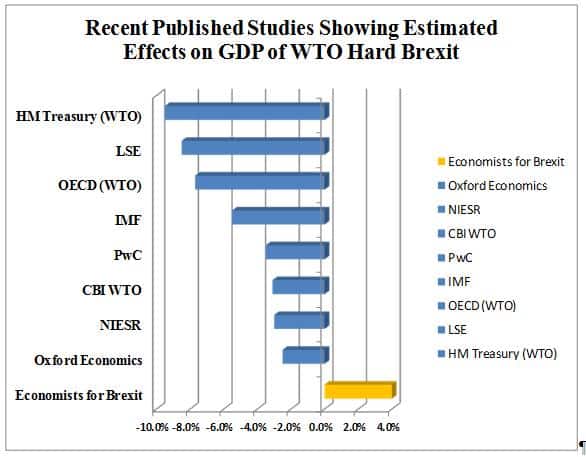
Chart 1 shows outcomes ranging from -9.5% from HMT to plus 4% from the “Economists for Brexit” group. As a scale of reference, the worst outcome forecast would be equivalent to the impact the Great Financial Crisis (GFC) (2008/9) had on the British economy.
Chart 2 shows a larger selection of studies written over a longer period of time. It examines a slightly different question, namely what are the overall costs and benefits of EU membership for Great Britain. Again, estimates vary considerably.
Chart 2: Costs and Benefits of Remaining in the EU
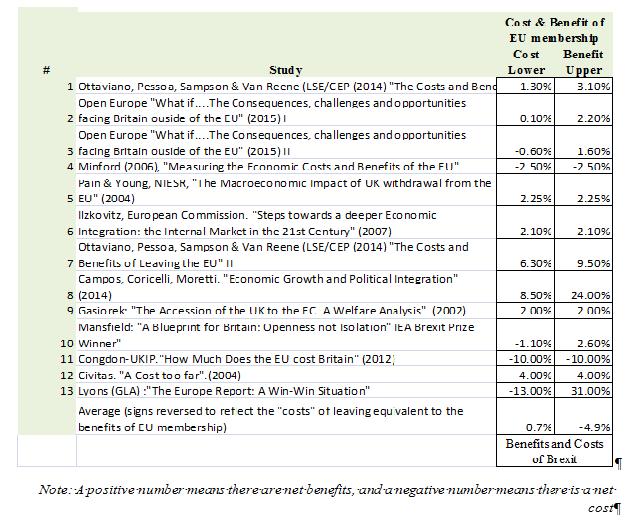
Note: A positive number means there are net benefits, and a negative number means there is a net cost
It has been argued that the tenor and timing of expected negative Brexit effects have been too pessimistic. In the short term output, consumption and the state of the financial markets generally performed better than expected in quarters 3 and 4 of 2016. However, there are a number of other areas that were largely overlooked. Thus, while business conditions appeared to improve post referendum, none of the forecasts managed to “predict” the 15% fall in the value of sterling. On its own, this is far larger than any of the predicted GDP changes. And attention in the UK was focused more on a short term lift in trading results of companies exporting, under continuing EU trade conditions, and less on the loss of value of GB assets when viewed from abroad. And this, at a time when the country continues to be dependent on the “kindness of strangers” to plug the yawning deficit in the current account.
Moreover, the Bank of England’s decision to cut short term interest rates, combined with the continuation of existing EU trading conditions means that Brexit has still not happened yet, and suggestions that recent improved economic performance somehow disproves these forecasts negative predictions is clearly wrong. The full effects of Brexit will only be felt in the period after the Article 50 negotiations. In the event of a transitional period, then the effects may be delayed further. On the other hand, the expectation of changes could well lead to changes in economic behaviour prior to the end of the Article 50 negotiating period, as producers and consumers re-position themselves to take best advantage of the new situation, even if this is not necessarily to the advantage of the overall economy[1].
What is striking about charts 1 and 2 above is that there is a considerable body of economic opinion who clearly regard Brexit in general, and a hard Brexit in particular, as being “bad” for the outlook of the UK economy, in stark contrast to the more optimistic views expressed by the Brexiteers.
This is relevant for this study. The scale of these expected negative changes shown in charts 1 and 2 form the “envelope” within which the scenarios here are developed. These scenarios consist of looking specifically at the estimated trade costs or trade burden of tariffs. On top of which, a more general deterioration in the economy through the various components of final demand is then set. The values chosen for the more general economic effects are informed by the expected changes shown above. They have been tilted towards larger reductions in private consumption and investment. (For more details see below)
This allows us to move beyond the level of macro economic generalities, important though they are, and to look in more detail at the likely damage that could be wrought at the sector, or “meso” level of the economy.
The core scenario (Scenario 0) being considered here is what might happen to the British economy in the event of Britain leaving the EU and the Common Market (the Single Market and the Customs Union) with no subsequent agreement with the EU. This would mean the imposition of tariffs on British-EU trade in both directions, leading to costs for both parties.The main focus here is to go beyond relatively bland statements about overall macro economic changes, measured in terms of changes to GDP, to concentrate more on the likely effects on actual economic sectors, as measured by the World Input-Output Database[2] (WIOD).
Significance of the EU as a source of Imports
There is no doubting the significance of the EU as a source of imports to Britain. Chart 3 shows the share of imports coming from the EU in the 20 most exposed sectors. The blue bars show sectors for which import tariffs will be directly levied. The yellow bars refer to sectors, mostly in the service sector, for which there are no direct tariffs. For the most exposed 15 sectors, the EU share of imports is currently over 60%.
Sectors that stand to be most seriously affected by the imposition of tariffs on EU source material are, Rubber and Plastic products, Wood and Cork products, Printing and reproduction of recorded media, Chemicals, the production and sale of motor vehicles, and food products.
Chart 3: Top Twenty sectors most dependent on EU imports

Source: WIOD, and author’s calculations
Note, yellow bars refer to sectors facing no direct tariff, blue bars incur tariffs
Not all sectors will be negatively affected by tariffs, for the reason that there are no distinct tariffs set for them under WTO rules. Tariffs apply to only 23 of a total of 55 sectors in the Input-Output tables (see below for more detail). However, service sectors with no direct tariff exposure will still be negatively affected by Brexit as the “ripple” effects from decreases in domestic demand affect the service sector.
Significance of non tariff barriers
There are important non tariff barriers (NTBs) that apply to many service sectors[3]. As with the other tariff effects, several studies have been conducted in this area, and their main results are shown below in chart 4. As can be seen there are different ways of measuring their impacts. Most, but not all, studies, suggest that NTBs are less problematic than tariffs themselves. As is argued later, we are inclined to think that in the medium term, NTB impacts are likely to be much larger than tariff effects, at current WTO Most Favoured Nation tariff rates.
Chart 4: Summary of studies of Impact of Non-Tariff Barriers.
| Author | NTB estimate applied to: | Quantitative Result |
| Steinberg (2017) | Intermediate Goods | -5.2% |
| Steinberg (2017) | International Services | -2.9% |
| Steinberg (2017) | Final Demand | -9.2% |
| CEPR (2013) | NTBs generally | 5.8 times tariff effect |
| Ciuriak (2015)` | National Impact | -2.6% |
| Ciuriak (2015) | Transport Equipment | 57.7% of tariff effect |
| Ciuriak (2015) | Food Manufacturing | 33.3% of tariff effect |
| Ciuriak (2015) | Transport goods | 28.6% of tariff effect |
| Ciuriak (2015) | Accommodation | 175% of tariff effect |
| Ciuriak (2015) | Financial Services | 88.6% of tariff effect |
| Ciuriak (2015) | Border costs | -1.2% GDP |
| WTO | Overall NTB effect | 75% of tariff effect |
| Loi Kee et al (2009) | Overall NTB effect | 87% of tariff effect |
Source: Digit Ltd
Although NTB effects are not specifically included in the Input-Output scenarios developed below, their quantitative effects are likely to be at least in the order of 1.5% of GDP, and probably much higher.[4] To which can also be added the negative impact of border controls, estimated here at another 1.2% of GDP – suggesting a total of a near 3% drop in GDP from these effects alone.
The very pervasiveness of NTBs in the medium term is such that they will destroy the current considerable freedoms enjoyed within the EU (including the Schengen area) by British businesses and individuals to locate business activity without let or hindrance, on exactly the same terms as the locals. After a hard Brexit this will no longer be the case. Indeed, in the event of an acrimonious separation, the possibility of visa limited travel to the EU cannot be ruled out either[5].
Estimating the Costs of Trading after a hard Brexit
One of the most significant changes occurring in the event of a hard Brexit will be the imposition of tariffs on trade with the EU. These additional costs can be estimated by combining data from the WIOD database and the WTO data on Most Favoured Nation Tariffs (MFN). In this way a synthetic tariff per Input-Output sector (where relevant) can be estimated[6]. The sum of the additional costs involved in both importing and exporting constitutes a trade “burden”. From a trader’s point of view this burden consists of:
- The costs of paying import tariffs on inbound goods to the UK from the EU
- The costs of paying tariffs on outbound goods to the EU
The total trade burden consists of all import tariffs levied by the UK, and from a traders point of view, the value of all “export” costs on exports sent to other countries. There is a distinction here between tariffs as seen by the government and as seen by traders.
At the moment the proceeds of the Common External Tariff falling on imports into the UK from outside of the EU are remitted to Brussels. After a hard Brexit, these sums will stay with the British government. From a trader’s point of view this makes scant difference. From the government’s point of view, leaving the EU opens up an additional revenue source; the government directly gains additional resources from protecting domestic goods and services. This gives rise to collusive behaviour between governments that seek revenue, and inefficient domestic industries that earn higher profits because of import tariffs[7].
The cost burden on imports facing traders is the tariff rate times the volume of imports. This represents sums of cash that have to be met by importers in order to pursue their business. This represents a drain on their cash flows, and requires them to hold higher cash balances as a result.
The cost of exports is similar but different. Exporters may have to pay for the cost, insurance and freight charges to get their goods to their export markets. Their customers then have to pay their import duty on UK exports. Depending on the market structure, meso corporations may have options as to how this is treated. If the imposition of an export “duty” pushes up the price of their products relative to the local competition, they may (if the tariff is not punitive) choose to absorb this by reducing the prices in local currency terms, or in just earning a smaller margin on the product/service. These can be seen as costs to the trader, and they are treated as such in this exercise. The export costs are considered to be the sums paid by exporters to market and deliver their products to foreign markets – expressed as the tariff rate in the destination country times the volume of export trade. These can be considered the costs of complex international supply chains (see below for more details).
While exact behaviour differs from sector to sector and from company to company, the size of these costs can be compared to the sector value added to gain a better impression of their significance. A hard Brexit will increase trading costs, and so make international trade less profitable than it was pre Brexit. This will have a negative impact on future trade strategy.
International Supply Chains
Some industries have carefully crafted international supply chains. These may involve transferring products several times across borders. Components pass through several intermediate production steps before being included in a final assembly plant, either in the UK or elsewhere in the EU.
Pre Brexit, such chains have flourished, taking advantage of different levels of specialization, and in obtaining advantages from economies of scope and scale. The automobile industry (sector 20) stands out in this respect, as does Other Transportation Equipment (sector 21). Post Brexit, the cumulative trade burdens could well grow to the point that it is no longer economic to continue with such international supply chains. There are other industries that would be similarly affected. Post Brexit, these UK based supply chains will be faced with decisions. Either they will pass on the tariff costs as higher prices, and risk losing market share, or they will absorb these costs, thus reducing the value added earned as a result of these transactions. For the purposes of this analysis it is assumed that the supply chain absorbs both the import and export tariff costs.
In this report only the likely tariff effects have been estimated. Scenario 3 goes some way toward doing this by limiting the downside to those industries most exposed to foreign trade. (See below for more details). In our view estimates in this report are lower bound values. Actual outcomes could well be worse than those shown here.
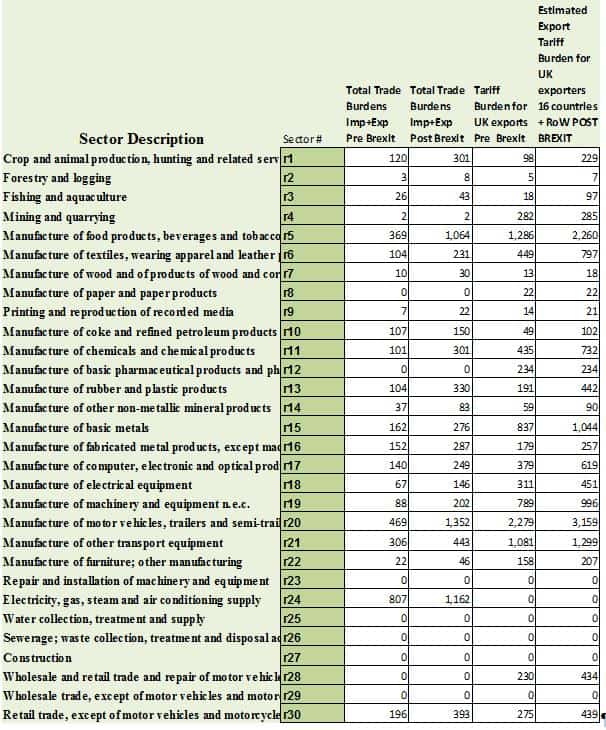
Trade Burden Estimates (tariff costs)
The combined impact of import and export trade burdens are shown below in charts 5 A and 5 B. The charts also provide a full description of the 55 sectors in the Input-Output tables. There are many sectors, as shown in table 5B, where the international trading costs are effectively zero, owing to a lack of specific tariffs levied. The fate of these sectors revolves around NTBs and on access to markets, both inbound to the UK, and outbound as UK exports.
Table 5 C links the trade data, obtained by combining WIOD and WTO information with the 2014 national Input-Output table for Great Britain. The estimated trade burden rises from around 0.5% of GDP up to 0.91% post Brexit, similar to those recorded in earlier studies on Brexit.
The major differences between pre and post Brexit trade burden is the additional tariff burdens imposed on trade with the EU. The estimated burden on the export side are frequently larger than on the import side despite of the fact that import volumes are generally larger than export volumes – the UK runs a large foreign trade deficit.
Chart 5A Trade Burden Costs By Sectors 1 to 30. In US$ mill (2014)
The main reason for this is that the UK and EU have relatively low tariff regimes. And this is true for most of the OECD “developed” world. Following WTO trade rounds, agreed tariff levels has fallen substantially – in some cases to where they are now virtually non-existent. Both Switzerland and Norway effectively are free trade zones, with no recorded MFN tariffs.
Chart 5B Trade Burden costs Sectors 31 to 55. In US$ mill (2014).

Note: The fact that there are no specific tariffs affecting service sectors does not mean they are unaffected by Brexit. As explained above, they are strongly affected by NTBs, about which only incomplete information is available – so they have been excluded on this ground. The service sectors will be affected by any changes in domestic demand following on from Brexit, which follows from a reduction in trade flows following Brexit. This comes under the indirect “ripple” effects referred to elsewhere in this report.
Table 5C Trade Burden and Impact on Input-Output Categories

Source: WIOD, WTO, Digit Ltd calculations
Other Features of UK International Trade
One of the Brexiteers’ arguments is that freed from the bureaucratic weight of Brussels, Britain will quickly be able to build vibrant new trade deals with the rest of the world. That being a member of the EU has not so far prevented Germany from running a trade surplus with China is not even mentioned. And this despite the considerably higher tariff protection enjoyed, under WTO rules, by many of these larger potential export markets. Chart 6, using the harmonized systems (HS) trading data, shows the average level of MFN tariffs for 11 countries, including the BRICs.
Chart 6

As can be seen, average tariff values of over 10% prevail in five of the countries, all of them significant markets. For the UK to make good any losses resulting from a hard Brexit, UK exporters have to overcome a much tougher tariff regime, in markets geographically distant from the country.
Chart 7

Chart 7 shows the amount by which exports would have to increase to compensate for a 10% fall in the value of exports to the EU. The higher the bars, the lower is the current share of exports to these countries in British exports. And while both the US and Chinese markets could absorb more British exports, achieving this will be difficult. The facts suggest that it is easier to trade with your neighbours, and that Brexit will make this materially more difficult with the EU. Trading with new partners, operating behind their own steep tariff walls will be difficult. Thus far, British exporters have not fared particularly well.
This can be seen in the EU context in chart 8 below. Despite not facing any tariff barriers within a common market, Britain runs substantial trade deficits with all of our close EU partners. The major exception to this is Ireland, with which Britain runs a trade surplus. This may act as a further complication for Ireland as it considers its options arising from Brexit.
Chart 8 UK has a deficit in its trade with all larger EU member states: 2014

In a more detailed analysis of trade flows by product and country, (Black et al (2017b), the two largest trade areas, when ranked by trade volumes, for both destinations of UK exports, and sources of UK imports, are the Rest of the World, and the USA. The relative importance of markets such as Australia, Canada, India, all members of the Commonwealth and former members of the British Empire, is small. And the rankings of BRIC and other emerging markets are often even lower. Over 40 years, membership of the EU has strengthened trading ties with other member states (as expected and wished for), meaning that the sacrifices involved with a hard Brexit will be all the more painful. As it is, the recent 15% devaluation of the Pound against the Euro is driving up living costs and depressing living standards.
Trade Burden and Value Added
When seen from a corporate point of view, and that of an international trader, the imposition of tariffs brings with it a number of consequences. It immediately increases the paper work and bureaucracy associated with international trade. It increases uncertainties as to when products will be delivered to customers. It involves setting up and funding new export or import departments, and complicates book keeping arrangements. Add to this difficulties with product standards, quality issues, recognition of different processes and techniques, and foreign trade becomes notably more complex than within a customs free trading zone.
Not the least of it is that import tariffs have to be paid on entry into the country, increasing cash flow requirements. If the goods in question are part of a longer supply chain, then they have to be paid for before the goods are sold. Other intra-company purchases can be handled differently.
These costs have to be absorbed. In some situations companies may pass additional costs on to their customers. In sectors where market competition is high, and demand is sensitive to price, traders may choose to absorb additional trading costs, and accept lower profit margins as a price of staying in a market.
The combined tariff burden estimated above is compared to sector value added and shown in chart 9 below. Value added consists of payments to labour, and retained profits. And this forms the basis on which salaries and wages are paid, and profits are earned for shareholders.
Chart 9 Total Trade Cost effects

The total tariff burden, post a hard Brexit, is equivalent to nearly 25% of sector value added for the motor vehicle industry– highlighting the concerns shown by companies such as Renault-Nissan, Honda, and Toyota. The tariff burdens for basic metals, fishing, Other Transport Equipment, and textiles are in excess of 10% of value added. Food manufacturing, chemicals, oil refining, and other machinery also face additional costs equivalent to 5% or more of their value added.
While this may not sound a great deal to a bureaucrat, it may effectively cut profitability to zero in some cases, and jeopardize the continuation of these trading arrangements. In the absence of local substitutes, this could lead to further problems affecting the longer term economic viability of some sectors.
Economic and Trade Scenarios using an Input-Output approach
The Input-Output approach offers a way of understanding what the likely impact of Brexit will be at a sector level. The approach offered here is relatively straight forward, and requires relatively few additional assumptions, other than those contained in the Input-Output tables/approach themselves.
The economy, as measured by gross output (X), can be defined as the sum of intermediate production (A) and final demand (FD). In the Input-Output view, these relationships hold for 55 individual sectors. Intermediate production is used to produce other commodities, whereas final demand consists of goods and services consumed. There are six types of final demand, representing goods consumed by private households, by non-profit organizations, by government, for investment, for exports, and as changes in stocks. Changes in final demand can be used to calculate what the overall change in gross output will be. All of this is in terms of constant prices.
Import tariffs are a price phenomenon. Ideally details of the price elasticity of demand per sector would be needed in order to estimate the effects of price changes on demand[8]. These are not available. In order to simplify the analysis, and for the purposes of the argument, it is assumed that import tariffs affect intermediate output only, and are treated as an additional cost. With a given gross output, the “base line” gross output balance can only be maintained after the imposition of tariffs by lowering the overall efficiency of the system, in this case by lowering the surpluses earned as represented by final demand. And this is what is done in the following sections. The imposition of import tariffs is treated as a decline in the system’s overall efficiency, and thus as lower final demand.
The initial incidence of these trade costs is obtained from the WTO as explained above. And the initial “direct” costs of tariffs has already been estimated. As demand falls, there are then ripple effects through the rest of the economy. Lower final demand means lower intermediate demand, which in turn leads to second, third and fourth round effects. These are captured by what is known as the Leontief Inverse, named after an economics Nobel prize winner of the same name.
These initial effects (Scenario 0) are then linked to broader negative economic effects and trends identified in other studies summarized above. And here rather than taking a global x% reduction in GDP, scenarios are constructed weighted towards proportionately greater reductions in private household consumption and lower investment. [9] Using this approach allows us to estimate both the direct, and indirect (“ripple”) effects throughout the economy following the imposition of Brexit tariffs, as well as in their interactions with other changes in demand identified in other studies. This then is the background to the Input-Output analysis.
Scenarios
Three scenarios, in addition to the “static” costs associated with the tariff imposition (Scenario 0), are shown below. Our scenarios all produce negative effects. As explained above, there is little evidence that Brexit hard Tariffs will, on their own, encourage an expansion of trade to the rest of the world, given that tariff levels elsewhere are either equal to, or are higher than those imposed by the EU. Issues around potential regulatory budget savings from Brexit are ignored on the grounds that similar regulatory “instances” will have to be established at a national level, the cost of which will be commensurate with any savings. [10] In the unlikely event of new trade deals, it also has to be realized that under WTO rules, benefits accorded to one country generally have to be extended to all – rather nullifying any specific tariff advantages to Britain.
Chart 10
| Scenario Number | 0 | 1 | 2 | 3 | |
| Scenario Title | Gross Trade Tariff Burdens | More gradual response | Short Sharp Knock | Slow Growth in sectors with High IIT index | |
| Component of Final Demand | |||||
| Number of years forecast | 1 | 5 | 1 | 1 | |
| Private Household Consumption % Change | 0 | -2 | -4 | -8 | |
| Non profit Instit %Change | 0 | -2 | -3.9 | -8 | |
| Government Consumption % Change | 0 | 0 | -2 | -5 | |
| Gross Fixed Capital Formation (investment) % Change | 0 | -3 | -5 | -15 | |
| % Change in Inventories | 0 | 0 | 0 | -3 | |
| Exports % change | 0 | -2 | -5 | -15 | |
| Other | Reduction in Final Demand by amount of tariff burden only | Smaller initial changes continued for longer | Changes packed into one year | Demand falls only in sectors exposed to international trade | |
| Effective overall change in Final Demand | -3.5 | -0.52 | -6.8 | ||
| Result: Estimated Change in gross output | -0.53% | -3.60% | -8.5% | -11.60% |
The basic assumptions and main outcomes (at the macro level) are shown in chart 10 above. The figures refer to percentage changes to that part of final demand from 2014 levels shown in the national WIOD table for the UK. The scenarios consist of declines in final demand, occurring at different rates according to each section of final demand. The figures refer to an expected percentage change in each final demand component, normally expected to occur over one year. The outcomes compare the resulting required gross output levels with the base line, or status quo achieved in 2014.
Scenario 0 (Base line) is the simplest. The combined effects, post Brexit, of the tariff burdens have been deducted from final demand. This results in a decline in gross output of just over half a per cent. This confirms earlier remarks that the direct impact of the tariff imposition, at the macro level, will be slight. It has already been shown that when looked at in terms of individual sectors, the tariff impact will be more varied than this. This excludes any indirect “ripple” effects.
Scenario 1 considers a smaller but lengthier adjustment over five years. The most seriously affected part of final demand is investment. This and the following scenarios include the indirect ripple effects on the rest of the economy. Scenario 2 considers a “short sharp shock”, with larger declines in final demand over a shorter period of time. Scenario 3 applies more serious demand reduction only to those sectors particularly well connected to international markets. This is measured by the Intra-Industry Trade Index[11].
Scenario 0: Impact of the Tariff Burden
This scenario is relatively simple. The imposition of tariffs on both imports and exports, post Brexit, will increase costs considerably for some sectors. Chart 11 looks how the imposition of these costs then affects other sectors in the economy.
Chart 11

The most heavily affected sector is Fishing and Aquaculture, which under this scenario could experience a 30% drop in gross output as a result of the tariff imposition. This is followed by Forestry and Logging. Both sectors depend on selling and buying products from the EU. Other sectors such as the oil/coal energy supply sector, printing, and wood manufacture could also experience drops in output of around 10%. The impact of the tariff burden has negative impacts on other industries, many of which will feature in the other scenarios. The chart is saying that Brexit for the Fishing Industry is a two edged sword. While fishermen may think they are regaining “control” over their waters, they are losing control over their markets. And they will be crucially dependent on reaching a deal with the EU. Failure to do so will probably result in the downsizing of the domestic fishing fleet. And it might well increase the sale of fishing permits to EU flagged boats.
Scenario 1: “Short, Sharp Knock”
Scenario 1 consists of a short, sharp knock, with the changes being experienced over a one year period. The overall average reduction in final demand is -3.5%, and this results in a drop of output of 3.6% for the economy as a whole.
Chart 12

In this scenario the effects of the reduction in final demand are spread more widely across the economy. The worst affected sector is the Basic Metals, followed by Other transport equipment – largely aerospace and railway equipment. Both of these sectors could experience a drop of 5% in gross output. Other sectors quite strongly affected are Machinery and Equipment, Scientific Research, electrical equipment, a part of the financial sector and construction.
The list contains several industries that are “key” to the future prosperity of the country. A loss of between 3 and 5% of output constitutes a significant challenge to business. If regarded as permanent, it could also give rise to job losses and rises in unemployment. The chart also shows how behind the broad generalizations there are significant differences in the scale of the effects, and the damage they are likely to cause. If one were to put a regional dimension to this chart, then the main geographical areas most vulnerable will be outside of the London and the South East. Rather it will be areas in the Midlands and the North of the country that stand to be more negatively affected by this scenario.
Scenario 2: Slow and Sustained losses over a 5 year period.
This scenario is a steady decline over a 5 year period. The annual amounts involved are modest, the cumulative results are more worrying. The overall estimated reduction in final demand is -8.5%. This resembles a decline similar to that experienced following the Great Financial Crisis of 2008/09.
There are several striking features of chart 13 below. The horizontal scale is a lot larger. And the overall decline in output in the worst affected individual sectors are experiencing much sharper contractions, greater than in scenario 1.
The worst affected sector is now construction. And this comes not from the imposition of tariffs, but from the generalized weakness in demand elsewhere in the economy. This weakening in the derived demand for construction services, it is not something that monetary and interest rate policy will affect greatly. Scientific Research is the next most affected sector – an area that most governments have spent a lot of time and attention on trying to support. Other newcomers to the list include more service related sectors; Architecture (dependent on construction); computer programming and consultancy, motor vehicles, real estate. These could be described as the heart of both the manufacturing and service industries. Regionally, the negative effects are now spreading into London and the South East too.
Chart 13

Scenario 3: Decline limited to Highly Internationally Integrated Sectors
A more selective scenario was developed. This is a more negative scenario, however it is limited to those sectors most integrated into the international economy. The remaining sectors experience no change in final demand from 2014 levels.
In order to select the right sectors, an intra-industry index (III) was used. This rates sectors as being independent of international trade when the index has a value approaching zero. An index rating of 100 means that the industry is highly integrated into the global trading system in the sense that the bulk of output is exported, and the bulk of inputs are imported. For the purposes of this exercise the industries with a greater than average III level were considered to be those strongly integrated. These sectors were then subject to the “severe”.
Chart 14

The Intra Industry Trade Index(IIT) is defined as ABS(X-M)/(X+M), where X are Exports, and M are imports. ABS is the absolute value of the X-M term. Source Digit Database & own calculations
The sectors included are those having an above average Intra Industry Index (III) value, plus the automobile industry. The sectors are slightly different from those seen in the other charts. High III values are characteristic of Telecoms, the retail trade, Paper, Post and Courier services. Other services include Warehousing, Air transport, and Accommodation.
The estimated overall negative impact on final demand is -6.8%, and gross output falls by -11.6%. The skewed way in which the sectors are affected leads to great stresses in the system, with large output drops recorded in some sectors (see chart 15 below), offset by increases in other sectors.
Chart 15

Chart 15 shows the impacts in the most affected areas. The scale of the disruption is generally less than 10%, except for fisheries. There are a number of sectors included, even though they were not selected on the III list. They include:
- Computer manufacturing
- Computer programming
- Electrical Equipment
- Basic Metals
- Machinery repair
- Textiles
It appears that if the high IIT sectors were to be more affected by Brexit than others, then this in turn will lead to difficulties in apparently unrelated areas – although the key here might come from telecommunications which are important inputs into computing.
Conclusion
The report shows that there are ranges of sector outcomes from a hard Brexit that affect some sectors much more than others. And these will represent the “losers” should there be no agreement between Britain and the EU by the time Article 50 negotiations come to an end. As the scenarios darken, so the size of the sector effects rises. When compared to sector value added, the static trade effects are considerable for some sectors and would seriously reduce profit margins. Under more negative conditions the viability of some sectors would come into question. The estimates shown here are consistent with those reached in other studies (see Chart 1), extended to investigate sector impacts. At this level of generality the outcomes do not look good. It has also to be borne in mind that overall declines will be made worse when the effectgs of additional NTBs are included.
And expectations that independently struck trade deals between Britain and other non EU trading partners will yield a great export trade boom appear to be wide of the mark. Trading conditions in the rest of the world are generally much more difficult than they are in the EU. Hence it is difficult to espy the much mooted “upside” claimed by Brexiteers. The drive towards tariff disarmament and a reduction in non tariff barriers has been a constant and consistent theme in the post WW2 world. This report throws more light on why this is broadly speaking a “good” thing, and how moves in the opposite direction will damage British economic sector interests more deeply than is commonly supposed.
References
Baldwin, Richard, ed: “Brexit Beckons: Thinking ahead by leading economists”, VoxEU, August 2016; http://voxeu.org/content/brexit-beckons-thinking-ahead-leading-economists
Begg, Iain: “Brexit: why, what next and how?”, CESifo Forum, 17 (1). pp. 30-36. ISSN 1615-245X, 2016, http://eprints.lse.ac.uk/68861/
Booth, Stephen; Howarth, Christopher; Persson, Mats; Ruparel, Raoul; Swidlicki, Pawel: “What if… the consequences, challenges and opportunities facing Britain outside of the EU, Open Europe, 2015, http://europas-krisen.zdf.de/media/downloads/Brexit/150507-Open-Europe-What-If-Report-Final-Digital-Copy.pdf
Busch, Berthold; Matthes, Jügen: “Brexit – The Economic Impact, A Meta-Analysis”, Cologne Institute for Economic Research, April 2016; https://www.iwkoeln.de/en/_storage/asset/…/Brexit_meta_study_IW_report.pdf
Campos, Coricelli, Moretti. “Economic Growth and Political Integration”, 2014, anon-ftp.iza.org/dp8162.pdf
Ciuriak et al, “The Trade Related Impact of a UK exit from the EU Single Market” Ciuriak Consulting, 2015, https://papers.ssrn.com/sol3/papers.cfm?abstract_id=2620718
Congdon, Tim: “How Much Does the EU cost Britain”, UKIP, 2012, www.timcongdon4ukip.com/docs/EU2014.pdf
Dhingra, S; Ottaviano, G, Simpson, T; Van Reenen, J: “The Consequences of Brexit for UK Trade and Living Standards”, Centre for Economic Performance, LSE, 2016, http://cep.lse.ac.uk/pubs/download/brexit02.pdf
Dhingra, Swati ; Sampson, Thomas: “Life after Brexit: What are the UK’s options outside the European Union?”, The Centre for Economic Performance, CEP, LSE, http://cep.lse.ac.uk/pubs/download/brexit01.pdf
Eurostat, Eurostat Manual of Supply, Use and Input-Output Tables, 2008 edition, ISSN 1977-0375, http://ec.europa.eu/eurostat/documents/3859598/5902113/KS-RA-07-013-EN.PDF/b0b3d71e-3930-4442-94be-70b36cea9b39?version=1.0
Gasiorek, “The Accession of the UK to the EU. A Welfare Analysis”, Wiley, 2002, http://onlinelibrary.wiley.com/doi/10.1111/1468-5965.00363/abstract
GED study: “”Costs and benefits of a United Kingdom exit from the European Union ; Bertelsmann Stiftung, 2015, https://www.bertelsmann-stiftung.de/fileadmin/files/BSt/Publikationen/GrauePublikationen/NW_BREXIT_EN.pdf
HM Treasury analysis, “The long-term economic impact of EU membership and the alternatives” https://www.gov.uk/government/uploads/system/uploads/attachment_data/file/517415/treasury_analysis_economic_impact_of_eu_membership_web.pdf
House of Commons Library, “”Brexit: impact across policy areas”, Briefing Paper Number 07213, August 2016 ; http://blogs.law.columbia.edu/future-of-integration-conference/files/2016/08/CBP-7213.pdf
Ilzkovitz, “Steps towards a deeper Economic Integration: the internal market in the 21st century, 2007, ec.europa.eu/economy_finance/publications/pages/publication784_en.pdf
IMF: “United Kingdom, Selected Issues”, June 2016, https://www.imf.org/external/pubs/ft/scr/2016/cr16169.pdf
Jackson, James K.; Ilias Akhtar, Shayerah; Mix, Derek E.: “”Economic Implications of a United Kingdom Exit from the European Union ; Congressional Research Service”, July 2016, https://fas.org/sgp/crs/row/R44559.pdf
Kosaka, Hiroyuki; Yano , Takashi: “An International Input-Output Analysis on the Effects of Free Trade Agreements in Asia” EcoMod 2004, International Conference on Policy Modeling, June 30-July 2, 2004, Paris, France, https://ecomod.net/sites/default/files/document-conference/ecomod2004/103.pdf.
Ledda; Mattei, F.; Penteriani, S.:” The Use of Input-Output Analysis for the Evaluation of the Macroeconomic Impact of Electricity Tariffs Policy”, http://www.sascommunity.org/seugi/SEUGI1990/The%20Use%20of%20Input-Output%20Analysis%20for%20the%20Evaluation%20of%20Macroeconomic%20Impact%20of%20Electricity%20Tariffs%20Policy%20A%20Menu%20Driven%20System.pdf
Lee, Daniel; Leach, Anna: “CBI Literature review of the impact of EU membership on the UK economy”, February 2017, http://www.cbi.org.uk/business-issues/uk-and-the-european-union/eu-business-facts/cbi-literature-review-of-the-impact-of-eu-membership-on-the-uk-economy-pdf/www.cbi.org.uk
Lee, Gene K.; Schluter, Gerald E.: “The Effects Of Real Multiplier Versus Relative Price Changes On Output And Income Generation In Input-Output Models” Agricultural Economics Research 1 Vol. 29, No. 1, January 1977, http://ageconsearch.umn.edu/record/147775
Lyons, Gerard: “The Europe Report: A Win-Win Situation”, GLA, August 2014, https://www.london.gov.uk/sites/default/files/gla…files…/europe_report_2014_08.pdf
Mansfield, Iain: “”A Blueprint for Britain: Openness not Isolation””, Institute of Economic Affairs, April 2014; https://iea.org.uk/wp-content/uploads/2016/07/Brexit%20Entry%20170_final_bio_web.pdf
Milne, Ian: “A cost too far: an Analysis of the net costs and benefits for the UK of EU membership”, 2004, www.civitas.org.uk/pdf/cs37.pdf
Minford, Patrick: “”Measuring the Economic Costs and Benefits of the EU ; Open Economies Review, Volume 17, Issue 4, pp 509–524, December 2006, https://link.springer.com/article/10.1007/s11079-006-0362-x
OECD, “The Economic Consequences Of Brexit: A Taxing Decision”, 2016. https://www.oecd.org/eco/The-Economic-consequences-of-Brexit-27-april-2016.pdf
Office of Budget Responsibility, “Economic and Fiscal Outlook”, March 2017, http://budgetresponsibility.org.uk/efo/economic-fiscal-outlook-march-2017/
Ottaviano, Gianmarco; Pessoa, Joao Paulo; Sampson, Thomas: “The Costs and Benefits of Leaving the EU, LSE May 13, 2014, http://cep.lse.ac.uk/pubs/download/pa016_tech.pdf
Paine, Young: “The Macroeconomic Impact of UK withdrawal from the EU”, 2004, www.niesr.ac.uk/sites/default/files/…/1-s2.0-S0264999302000688-main.pdf
Park, Ji Young: “Application of a Price-Sensitive Supply-Side Input-Output Model to an Examination of the Economic Impacts: The Hurricane Katrina and Rita Disruptions of the U.S. Oil-Industry”, January 2009, Ecological Economics, https://www.researchgate.net/publication/239823945_Application_of_a_Price-Sensitive_Supply-Side_Input-Output_Model_to_an_Examination_of_the_Economic_Impacts_The_Hurricane_Katrina_and_Rita_Disruptions_of_the_US_Oil-Industry
PwC, commissioned by CBI: “Leaving the EU, implications for the UK economy”, 2016, https://www.pwc.co.uk/economic-services/assets/leaving-the-eu-implications-for-the-uk-economy.pdf
Schoof, Ulrich: “Costs and Benefits of a UK exit from the European Union”, Bertelsmann Stiftung, 2015, https://www.bertelsmann-stiftung.de/en/publications/publication/did/costs-and-benefits-of-a-united-kingdom-exit-from-the-european-union/
Slaughter and May: “Brexit essentials: Alternatives to EU membership” , Briefing, January 2016; https://www.slaughterandmay.com/media/2535258/brexit-essentials-alternatives-to-eu-membership.pdf
Steinberg, J:”Brexit and the Macro Economic Impact of Trade Policy Uncertainty”, University of Toronto, May 2017, https://www.economics.utoronto.ca/steinberg/files/brexit.pdf
Swinbank, Alan: World Trade Rules And The Policy Options For British Agriculture Post-Brexit, Briefing Paper 7, UK Trade Policy Observatory, University of Sussex, January 2017, https://www.sussex.ac.uk/webteam/gateway/file.php?name=briefing-paper-7-final.pdf&site=18
Wang, Jian; Charles, Michael B.: “IO Based Impact Analysis: A Method for Estimating the Economic Impacts by Different Transport Infrastructure Investments in Australia, 2010, CRC for Rail Innovation / Southern Cross University, http://atrf.info/papers/2010/2010_Wang_Charles.pdf
Endnotes
[1] The recent change in the exchange rate being a case in point.
[2] http://www.wiod.org/
[3] Non tariff barriers include product and safety legislation; acceptance of common standards and processes; mutual recognition of professional qualifications; restrictions on rights of business establishment; limits on immigration and the free movement of personnel; acceptance of products and services, and various passporting rights to entire the EU internal market.
[4] The main reason for their omission is that there is no direct evidence of their value for all the Input-Output sectors, and we are reluctant to assume a single value for all service sectors. Furthermore, this would constitute the entire measured “tariff” cost, and would unduly affect the outcome of the exercise.
[5] The Schengen Agreement includes all EU member states except the UK, Ireland, Croatia, Romania, Bulgaria, Cyprus. Monaco, Vatican City, San Marino are not members of Schengen, and have no border controls with Schengen member states.
[6] The Input-Output (IO) sectors are fewer in number than the harmonized system (HS) international trade scheme. Therefore the HS trade sectors were aggregated up to conform to the 55 IO sectors.
[7] This is something the British government laboured long and hard to eliminate in its determination to complete the internal market, a process largely attributable to Mrs Thatcher of the Conservative Party.
[8] Also details of the split between imports over intermediate and final demand, not readily available.
[9] On the grounds that some 19% of final consumption is made up of imports, and investment will reflect reduced prospects of selling into the larger EU export market.
[10] The net cost of EU membership has been estimated at between 0.5 and 0.75% of GDP. Authors calculations using WTO and HMT figures. Also See Begg (2016) . This is a relatively low figure, and represents very good value for money.
[11] For a definition of the IIT index see chart 14 below.