
by Prof. Colin Talbot, Emeritus Professor of Government at the University of Manchester, and
Dr. Carole Talbot, Research Associate, University of Cambridge
‘Levelling Up’ is back in the headlines with the move of Michael Gove to what has now become the Department for Levelling Up, Housing and Communities. One important change has been the extension of its remit to cover the whole UK, at least for ‘levelling up’, and not just England.
So we thought now would be a good time to revisit some work we started last year – just before the pandemic.
We decided to have a look at just one aspect of a potential ‘levelling up’ agenda – the fair geographical distribution of public money.
So we crunched some numbers for public spending per head of population. It produced some interesting results.
We decided to look at three years:
- 1997-98 – at the start of the New Labour government and before devolution to Scotland, Wales and later Northern Ireland
- 2010-11 – at the start of the Tory-led Coalition and austerity
- 2017-18 – the latest figures available (and 20 years after the first set)
Divided Nations?
The first numbers we looked at were for the four ‘nations’* of the UK. (*Yes, we know Northern Ireland isn’t a ‘nation’).
We took the UK spending per head of population to be 100, and worked out how far above or below this level each area was (as a percentage).
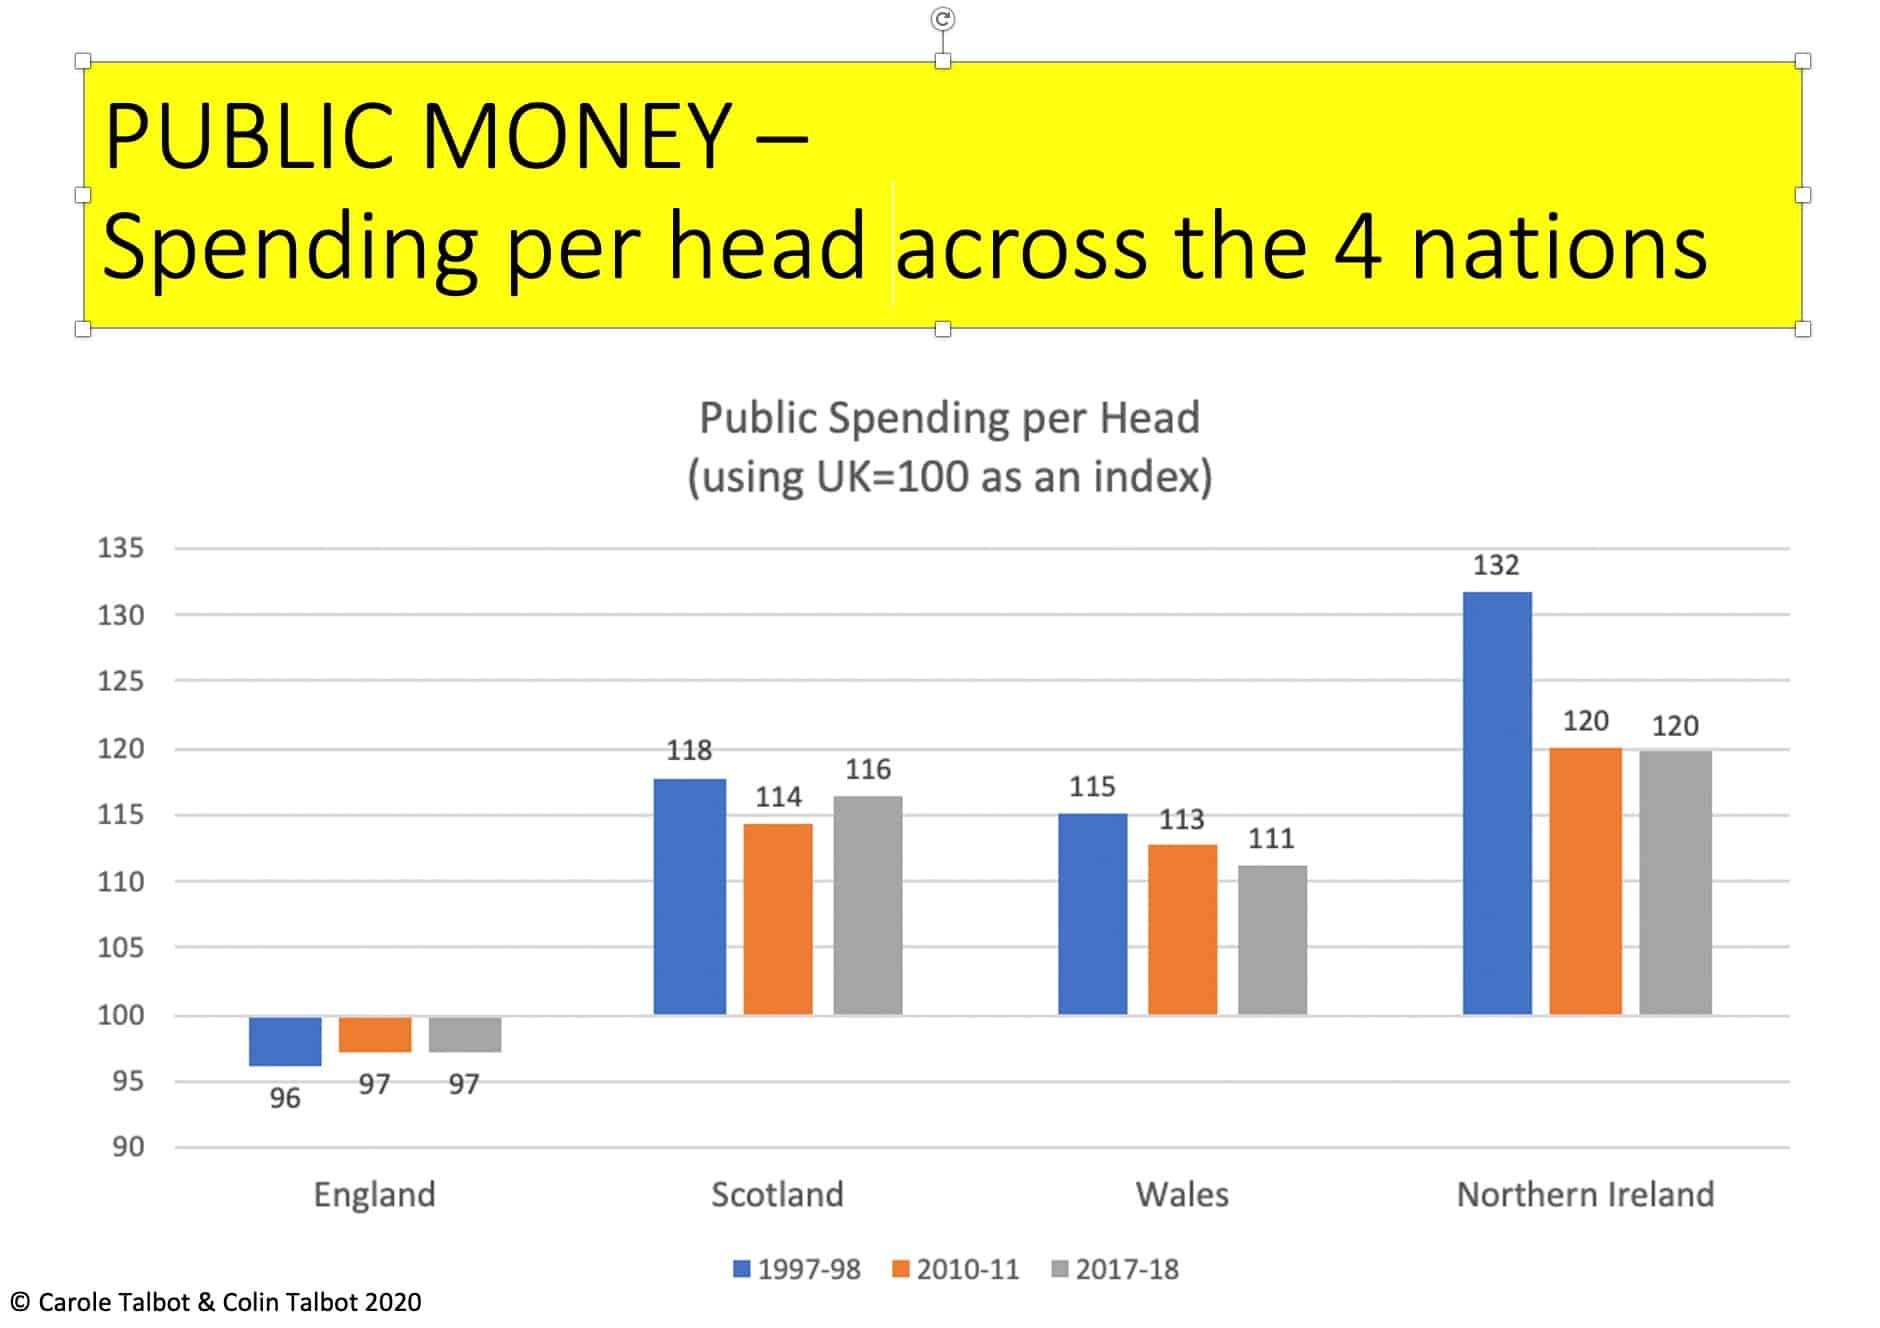
It turns out the three non-English parts of the Union get substantially more spending per person than England. This pattern is well known, so hardly a surprise. It has been driven by a combination of higher levels of need in Scotland, Wales and Northern Ireland and by politics.
We were slightly surprised by just how much the higher level of spending per person had dropped in Northern Ireland between 97/98 and 2010/11. It fell by almost a third. We assume this is due to a ‘peace dividend’?
We also noted the slight tendency over the two decades for spending in England, Scotland and Wales to converge.
What does not spring out, because spending England is so big relative to the others (£502bn in 2017/18), is that increasing English spending just to the UK average would have cost approximately £16bn extra.
Full “levelling up” for England – i.e. to the level of spending of the highest part of the UK (Northern Ireland) – would have meant substantially over £120bn. And that is without the extra for Scotland and Northern Ireland.
It is difficult not to conclude that “levelling up” public spending between the four divisions of the UK would be improbable, to say the least?
England
Next we looked at regional figures for England. Again, we used the UK average as an index (100).
There were some surprises. Although London did better than any other region in the 2010/11 and 2017/18 numbers the South East did not. Despite the fact that ‘London and the South East’ are often lumped together in policy discussions, it turns out that in public spending per head there are fairly wide differences.
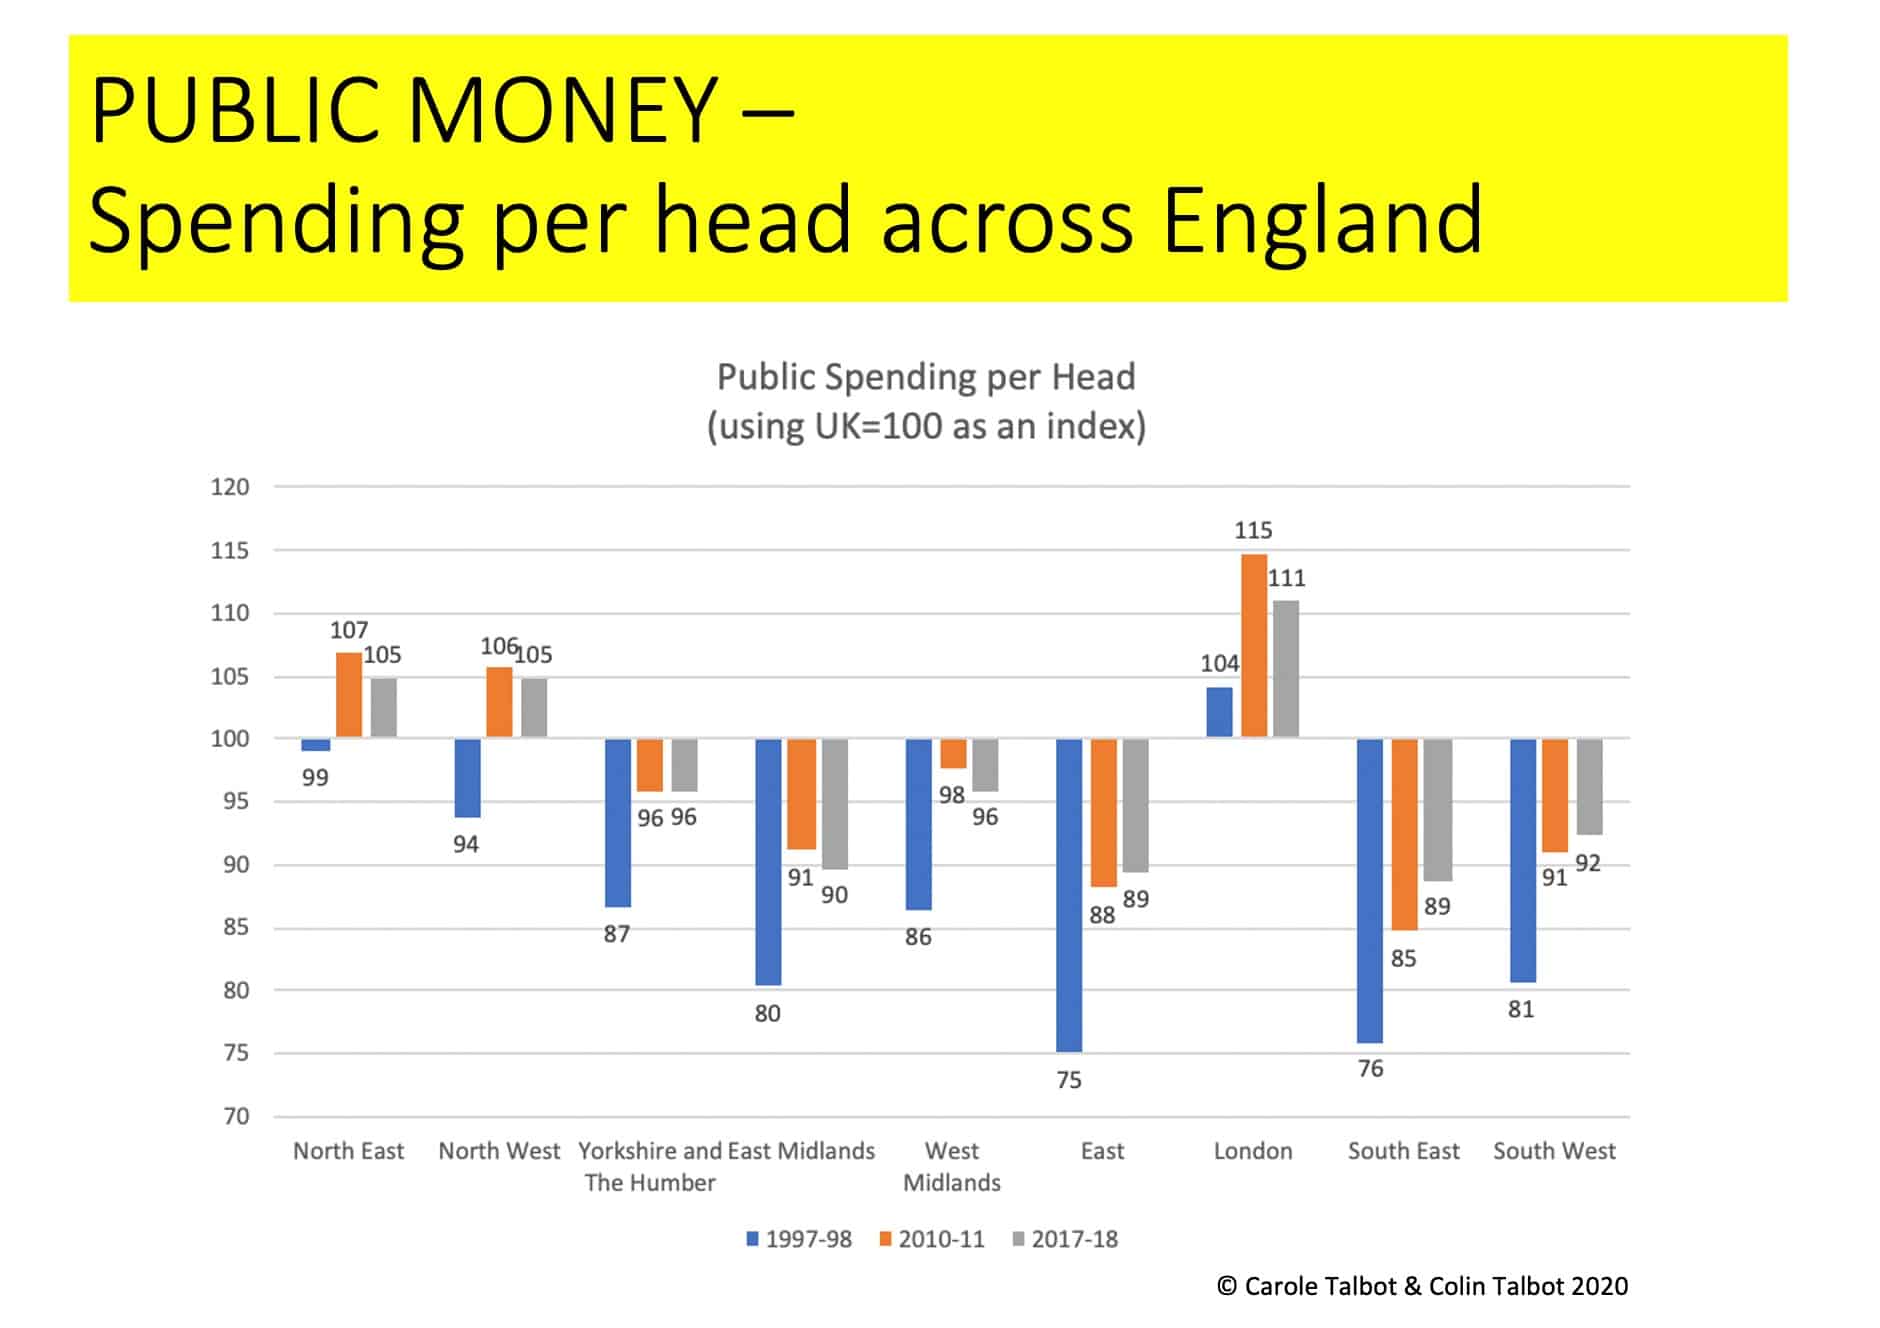
Also surprising was that the North West and North East – at least from 2010 onwards – were actually ahead of everywhere but London and above the UK average.
Part of the ‘left behind’ narrative has been that the parts of England outside of London have been neglected. And whilst it is true that every region other than London, the North West and North East remain below average for the UK as a whole the gap has clearly narrowed – especially under the New Labour government from 1997-2010.
This also reveals the true cost of ‘levelling up’ public spending across England – it would have cost northwards of £70bn in 2017/18 – much more now.
So the first conclusion from both the devolved and English regional perspectives is that any simply ‘levelling up’ of total public spending per head is probably unachievable.
Formula Funding?
Assuming you wanted to change the geographical allocation of public spending to even partially ‘level up’, how could you do it?
One issue you would have to tackle is what’s known in the jargon as ‘formula funding’. This is the practice of dividing up public spending by some, supposedly ‘fair’, distributional formula.
We estimate that roughly two thirds of UK public spending – 391bn in 2017/18 figures – is controlled by formulae (see pie chart).
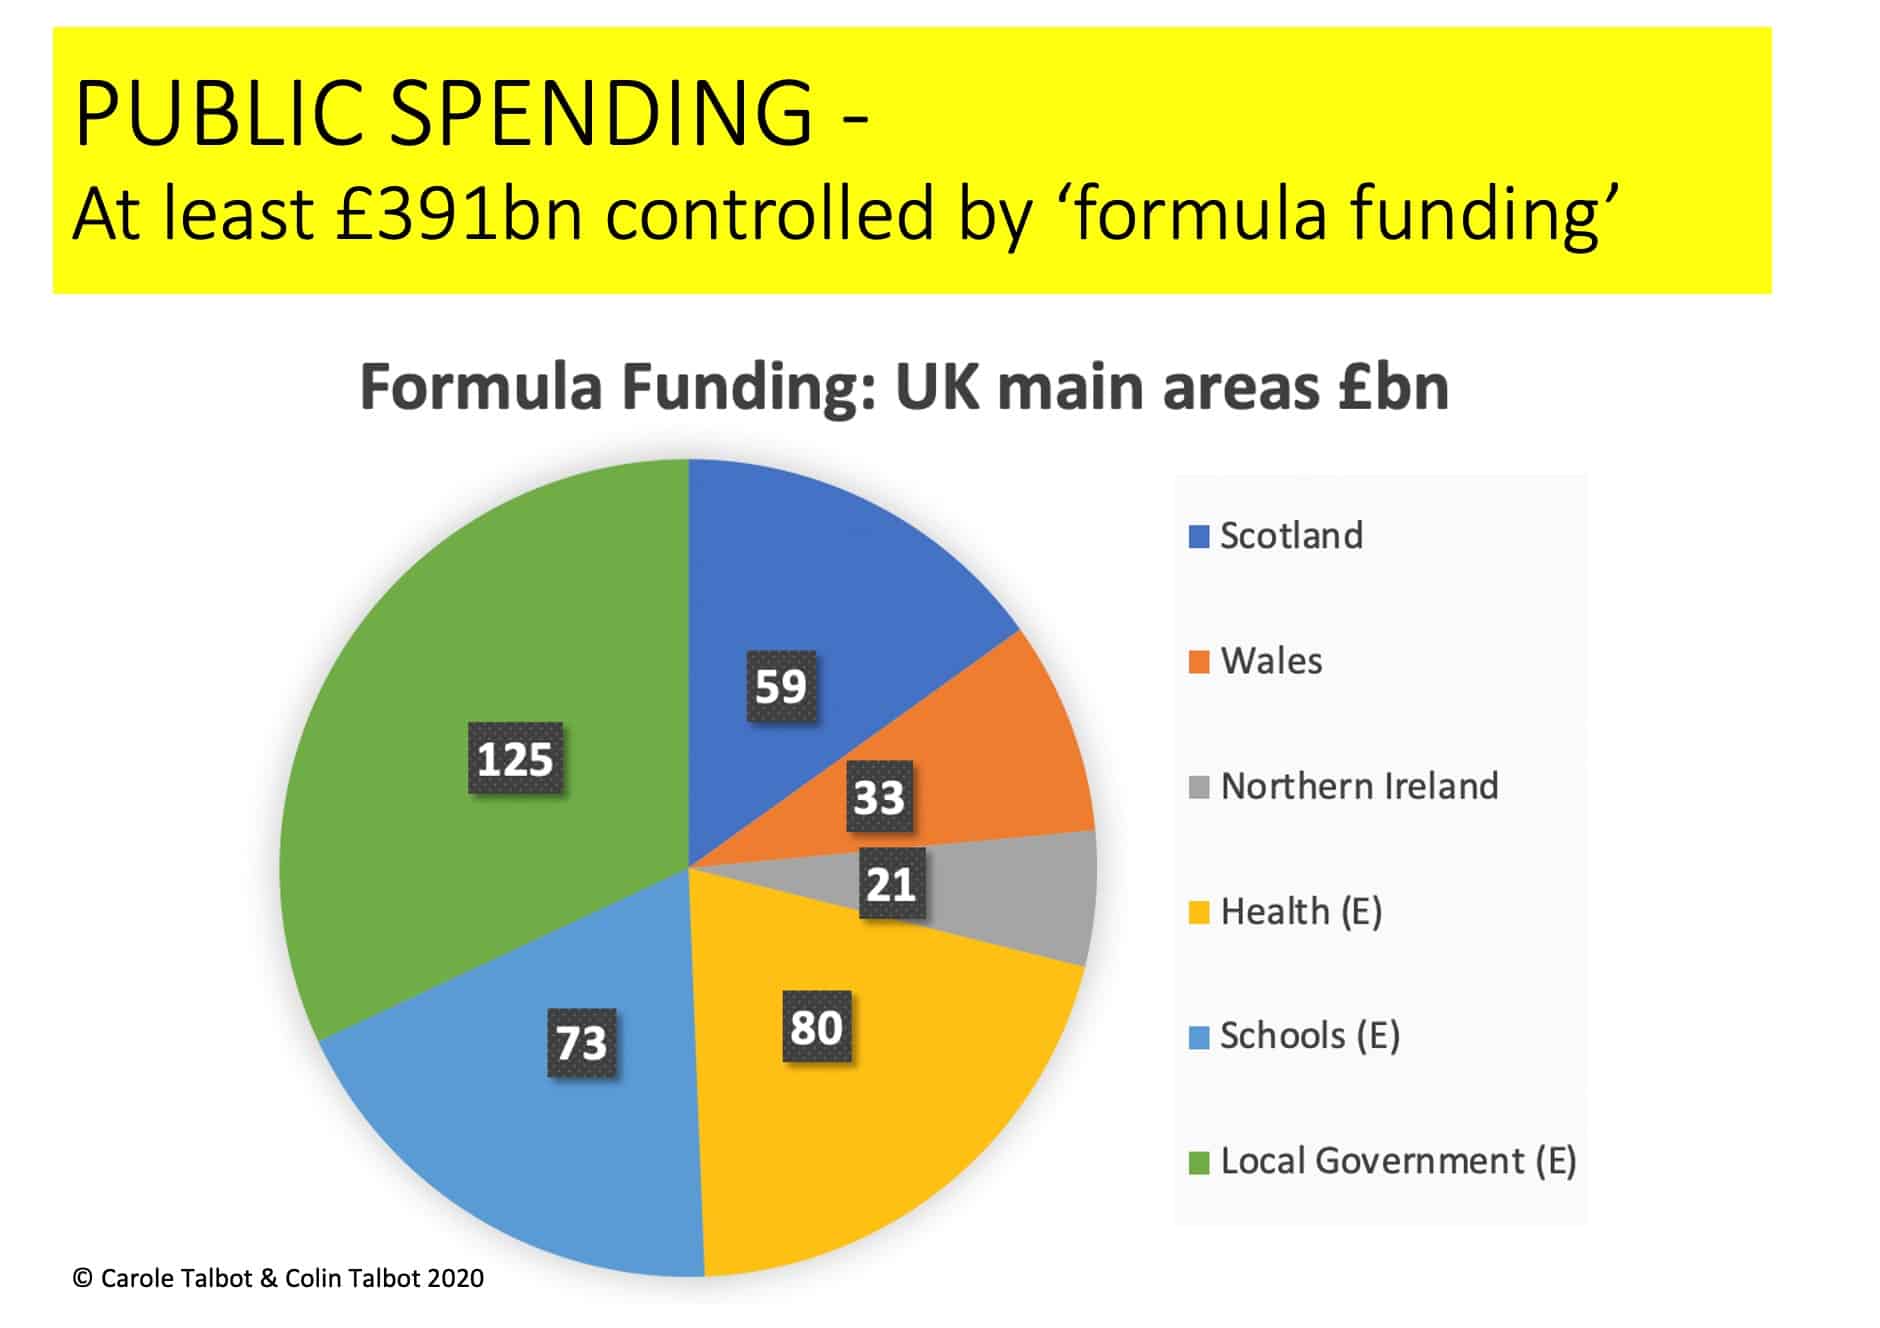
The first and probably well-known one is the so-called Barnett Formula. This determines how big the ‘block grant’ allocated to Scotland, Wales and Northern Ireland by HM Treasury should be, based on spending in England. That accounted for about £113bn in 2017/18.
But for many public services within England funding is also allocated on a formula basis – most of which are highly obscure and frequently subject to political tweaking by successive governments. Again we roughly estimated that for health, education and local government (within England) another £278bn of public spending is controlled by these formulae.
So any serious ‘levelling up’, or even just adjustment, of public spending on a geographical basis would require some serious reform of formula funding.
Fiscal Federalism?
We have only been talking about spending and any serious ‘levelling up’ ought to include income – the taxation side of “getting and spending”.
Many federal and quasi-federal systems of government have much more transparent and negotiated ways of dividing up the spending pie and finding the money to pay for it.
In Australia, for example, they have a Commonwealth Grants Commission (CGC) that aims to make it possible “for every State and Territory to provide similar standards of service (e.g. hospitals, education, social housing, transport and policing) with comparable levels of taxation, whilst allowing the benefits of decentralised governance and administration to be retained.”
The CGC considers ‘need’ in its deliberations, so it is no crude ‘levelling’ process’. What we hope this little investigation shows is that we are a very long way from any sort of levelling in the UK – so much so that the issues we raise here are hardly discussed.


Leave A Comment